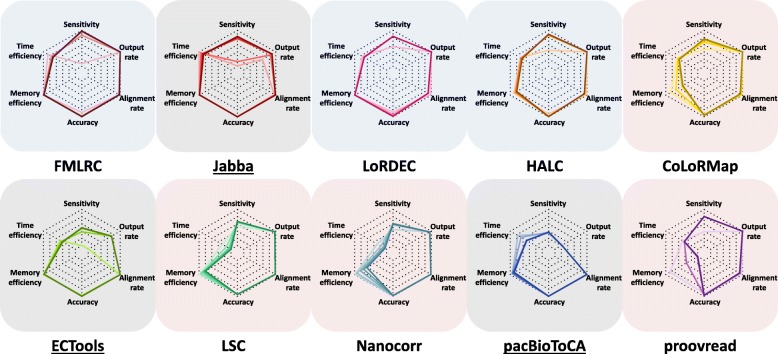
Fig. 6.
Radar charts of ten methods on E. coli PacBio dataset using five SR coverages. The six performance metrics include sensitivity, time efficiency, memory efficiency, accuracy, alignment rate, and output rate. The color depth is positively correlated to SR coverage. Time efficiency is computed as the log10 transformed run time that is further normalized to 0–1 range: 0 corresponds to the longest run time and 1 corresponds to the shortest run time among ten methods with five SR coverages. Memory efficiency is computed as the memory usage that is normalized to 0–1 range: 0 corresponds to the highest memory usage and 1 corresponds to the lowest memory usage among ten methods with five SR coverages. According to the overall performance, ten methods are grouped and shaded: blue—the graph-based FMLRC and LoRDEC plus the dual-based HALC; pink—the alignment-based LSC, Nanocorr, and proovread plus the dual-based CoLoRMap; gray—the selective methods Jabba, ECTools, and pacBioToCA

