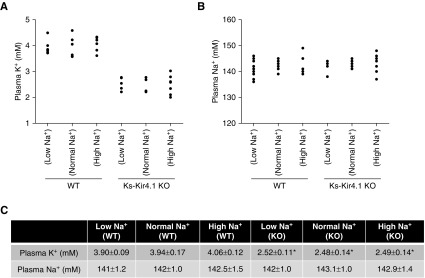
Figure 8.
Dietary K+ intake does not affect plasma K+ concentrations. A scatterplot graph showing plasma (A) K+ concentrations or (B) Na+ concentrations in WT and Ks-Kir4.1 KO mice on a low Na+, normal Na+, and high Na+ diets for 7 days, respectively (n=6–8 mice). The mean value and SEM of above measurements are shown in the table (C). * indicates a significant difference compared with the WT control (determined by two-way ANOVA).

