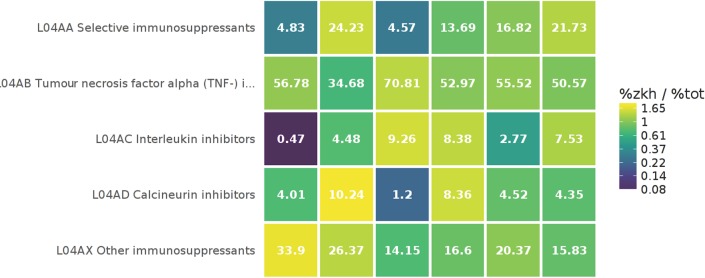
Figure 4.
Snapshot of the interactive pharmacotherapy heatmap. The heatmap shows per hospital the relative share of a chemical subgroup (ATC fourth level) within a pharmacological subgroup (ATC third level) with colours changing depending on how the proportion deviates from the proportion in all hospitals grouped together (the legend shows how the colour corresponds with the ratio between the hospital proportion (%zkh) and the overall proportion (%tot)). Calculations are based on number of patients. Each column represents one hospital and sums up to 100%. ATC, anatomical therapeutic chemical.

