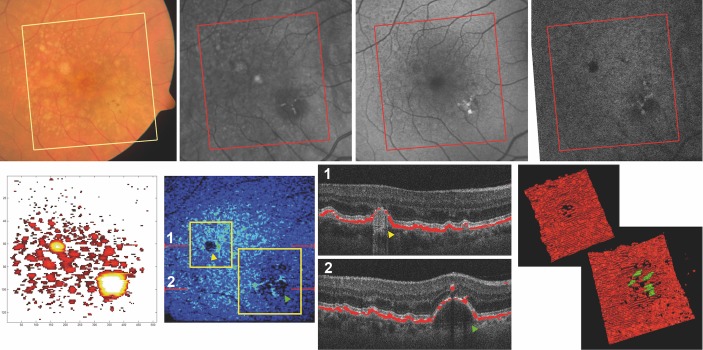
Figure 3.
Multimodal imaging and 3D reconstruction in detail. Top row, from left to right: fundus photography of the foveal area of a 67-year-old patient, followed by the infrared reflectance, the fundus autofluorescence and the near-infrared fundus autofluorescence images. The bottom row shows the manually segmented drusen map on the left, followed by the automatically generated thickness map of the RPE signal. The red lines indicate the position of the B-scans aside, and the yellow frames the positions of the 3D reconstructions on the far right. In (1) a druse with a grade 5 loss of RPE signal is shown (yellow arrowhead), while (2) shows a large DPED with pigment migration (green arrowhead). In the bottom right images, these drusen are shown in 3D, with pigment migration signal coloured in green. 3D, three-dimensional; DPED, drusenoid pigment epithelial detachment; RPE, retinal pigment epithelium.

