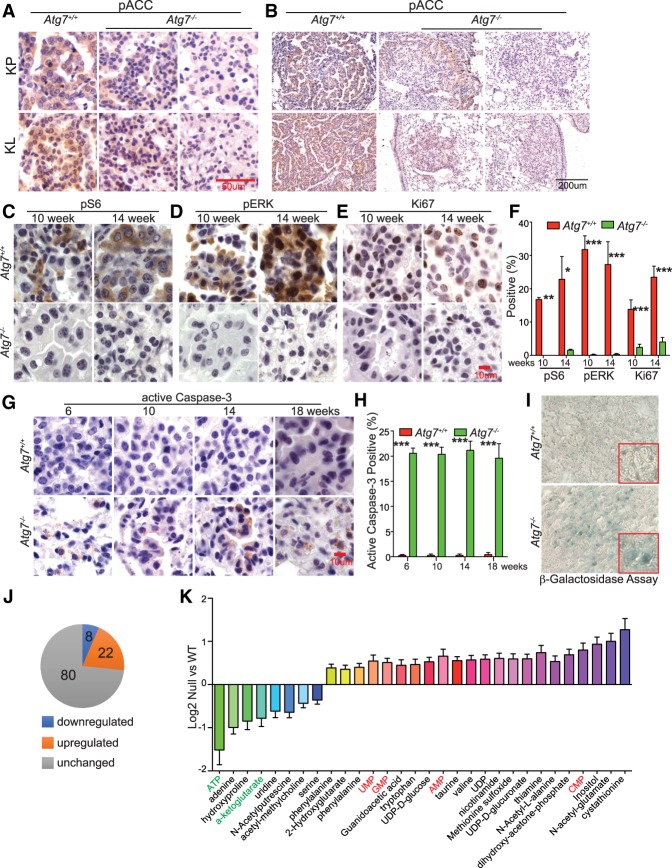
Figure 2.
Autophagy deficiency impairs oncogenic signaling. (A,B) Representative IHC of pACCS79 in KP and KL tumors at 18 wk after Lenti-Cre infection at high magnification (A) and low magnification (B). (C–E) Representative IHC of pS6, pERK, and Ki67 at the indicated times. (F) Quantification of pS6, pERK, and Ki67 from C–E. (G) Representative IHC of active caspase-3 at the indicated times. (H) Quantification of active caspase-3 from G. (I) Representative images of positive β-galactosidase staining at 18 wk after Lenti-Cre infection. (J) Comparison of metabolites between Atg7+/+ and Atg7−/− KL tumors obtained by liquid chromatography/mass spectrometry (LC-MS). (K) Levels of metabolites that show a significant difference between Atg7+/+ and Atg7−/− KL tumors. For all of the graphs, the error bar indicates ±SEM. (*) P < 0.05; (**) P < 0.01; (***) P < 0.001. See also Supplemental Figure S3.

