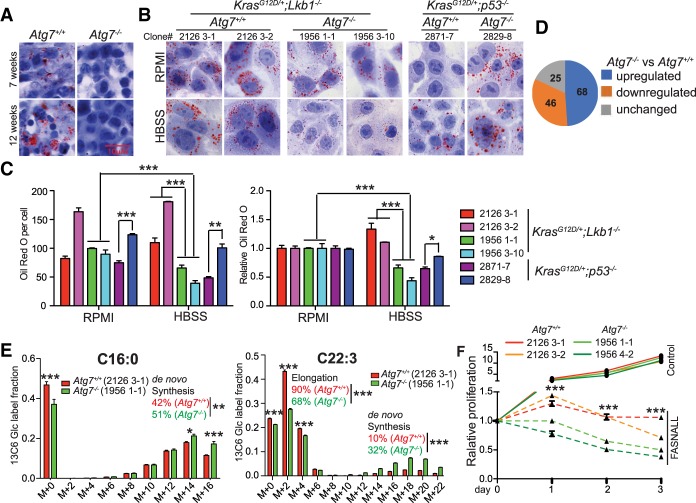
Figure 5.
Autophagy deficiency alters lipid metabolism. (A,B) Representative Oil Red O staining of KL tumors (A) and KL and KP TDCLs in RPMI and HBSS starvation (B). (C, left) Quantification of Oil Red O staining of TDCLs from ImageJ. (Right) Quantification of Oil Red O staining normalized to RPMI to show significant reduction of LDs in Atg7−/− KL TDCLs in starvation. (D) Comparison of lipids between Atg7+/+ and Atg7−/− cells in nutrient-rich conditions obtained by LC-MS. (E) [U13C6] glucose tracer labeling to FAs of TDCLs in steady state. (F) Cell proliferation rate in the absence or presence of 50 µM FA synthase inhibitor fasnall in a nutrient-rich RPMI condition. For all of the graphs, the error bar indicates ±SEM. (*) P < 0.05; (**) P < 0.01; (***) P < 0.001. See also Supplemental Figure S7.

