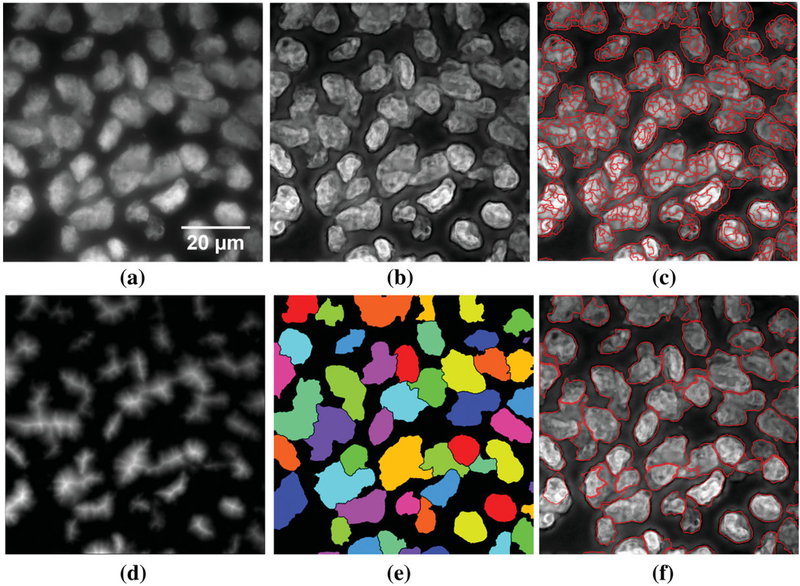
Figure 2.
Representative image and the corresponding outputs at different segmentation steps. (a) Original DAPI channel nuclei image. (b) Preprocessed nuclei channel. (c) Seeded intensity watershed output on image foreground. (d) GDT output. (e) Merged output of intensity and GDT watershed. (f) Final segmentation output after the cluster-breaking watershed and tree-based merging.

