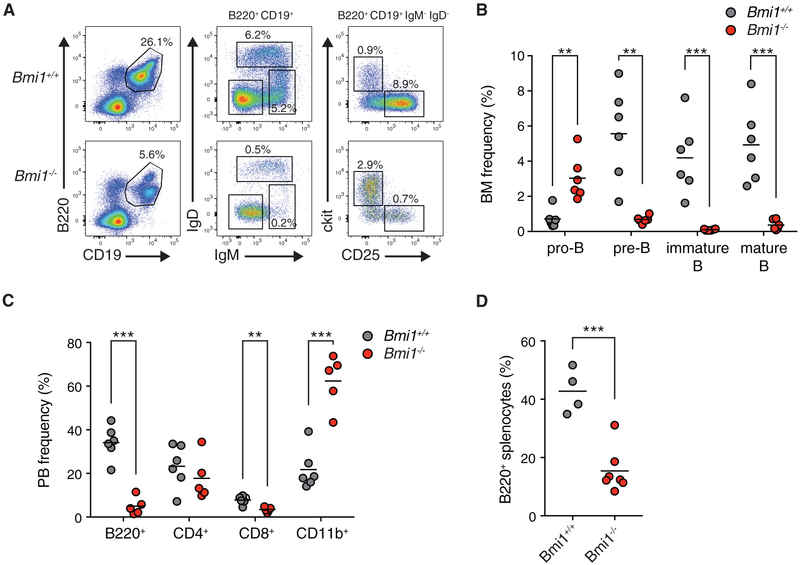
Figure 1. BMI1 Is Required for the Pro-B Cell to Pre-B Cell Transition.
(A) Representative fluorescence-activated cell sorting (FACS) plots of developing B cells in the bone marrow of indicated mice. Shown is the frequency of each cell population in the bone marrow of indicated animals. Pro-B: B220+ CD19+ IgM− IgD− ckit+ CD25−. Pre-B: B220+ CD19+ IgM− IgD− ckit+ CD25−. Immature: B220+ CD19+ IgM+ IgD−. Mature: B220+ CD19+ IgM+ IgD+.
(B) Frequency of indicated cell populations in the bone marrow of animals. Each point represents one animal; the line represents the mean. n = 6 for each genotype.
(C) Frequency of indicated cell type in the peripheral blood of indicated animals. Each point represents one animal; the line represents the mean. n = 6 for Bmi1+/+ animals; n = 5 for Bmi1−/− animals.
(D) Frequency of B220+ cells in the spleens of indicated mice. Each point represents one animal; the line represents the mean. n = 4 for Bmi1+/+ animals; n = 7 for Bmi1−/− animals.
***p < 0.001, **p < 0.01. BM, bone marrow; PB, peripheral blood.
See also Figure S1.

