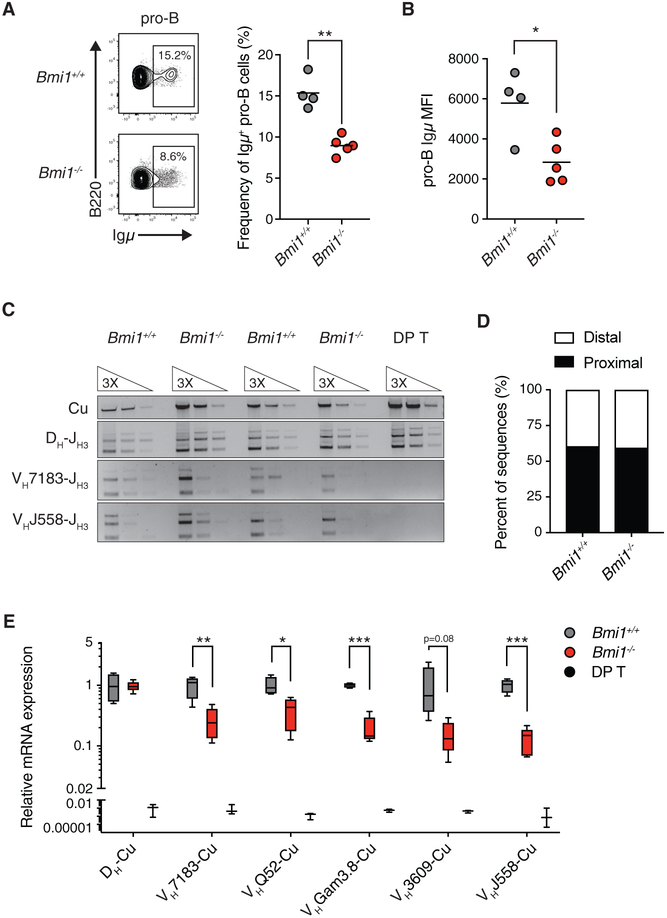
Figure 2. BMI1 Is Required for the Expression of Rearranged Igh Genes in Pro-B Cells.
(A) Representative FACS plot and quantification of Igμ chain-positive pro-B cells in Bmi1+/+ and Bmi1−/− mice. Each point represents one animal; the line represents the mean. n = 4 for Bmi1+/+ animals; n = 5 for Bmi1−/− animals.
(B) Igμ MFI in Igμ-expressing pro-B cells. Each dot represents one animal; the line represents the mean. n = 4 for Bmi1+/+ animals; n = 5 for Bmi1−/− animals.
(C) Semiquantitative PCR analysis of genomic DNA from sorted Bmi1+/+ and Bmi1−/− pro-B cells assessing the frequency of Igh locus rearrangement using either proximal (VH7183) or distal (VHJ558) VH gene segments. DNA from DP T was used as a negative control.
(D) Frequency of proximal and distal VH segments used in individually sequenced VDJH coding joints from sorted pro-B cells. VDJH joints were amplified using a promiscuous forward primer (MsVHe) and a reverse primer specific to JH3. n = 37 VDJH sequences for Bmi1+/+ pro-B cells, and n = 48 VDJH sequences for Bmi1−/− pro-B cells sorted from 3 animals for each genotype.
(E) qRT-PCR analysis of mRNA expression of rearranged Igh genes. DP T were used as negative controls. Data are shown as a Tukey box-and-whisker plot; the center line represents the median. n ≥ 5 for each genotype.
***p < 0.001, **p < 0.01, *p < 0.05. MFI, median fluorescence intensity; DP T, double-positive thymocytes.
See also Figure S2.

