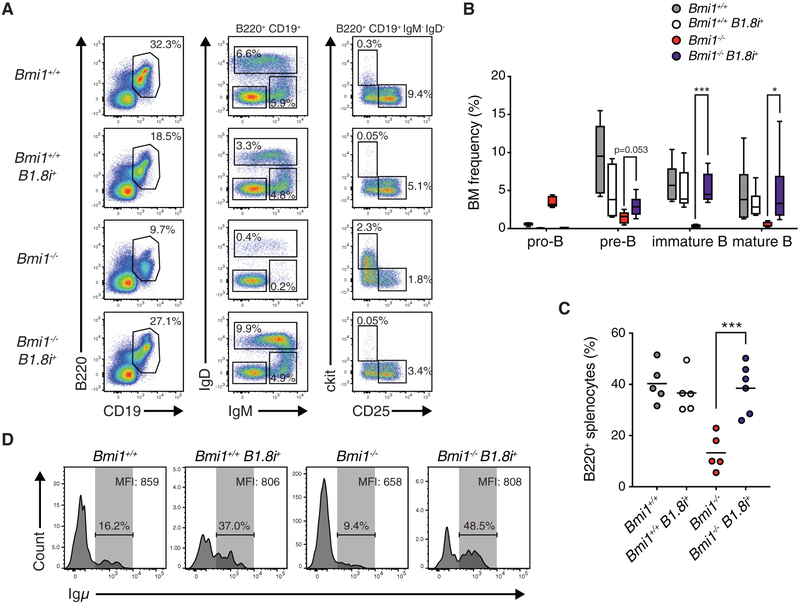
Figure 3. A pre-rearranged Igh Locus Restores B Cell Development to Bmi1−/− Mice.
(A) Representative FACS plot of developing B cells in the bone marrow of indicated mice. Shown is the frequency of each cell population in the bone marrow of indicated animals.
(B) Frequency of indicated cell type in the bone marrow of indicated mice. Data are shown as a Tukey box-and-whisker plot; the center line represents the median. n ≥ 5 for each genotype.
(C) Frequency of B220+ cells in the spleen of indicated mice. Each point represents one animal; the line represents the mean. n ≥ 5 for each genotype.
(D) Histogram showing the frequency of Igμ-positive pro-B cells from indicated animals. Igμ MFI in Igμ-expressing pro-B cells is indicated in the top right of each plot.
***p < 0.001, *p < 0.05. BM, bone marrow; MFI, median fluorescence intensity.
See also Figure S3.

