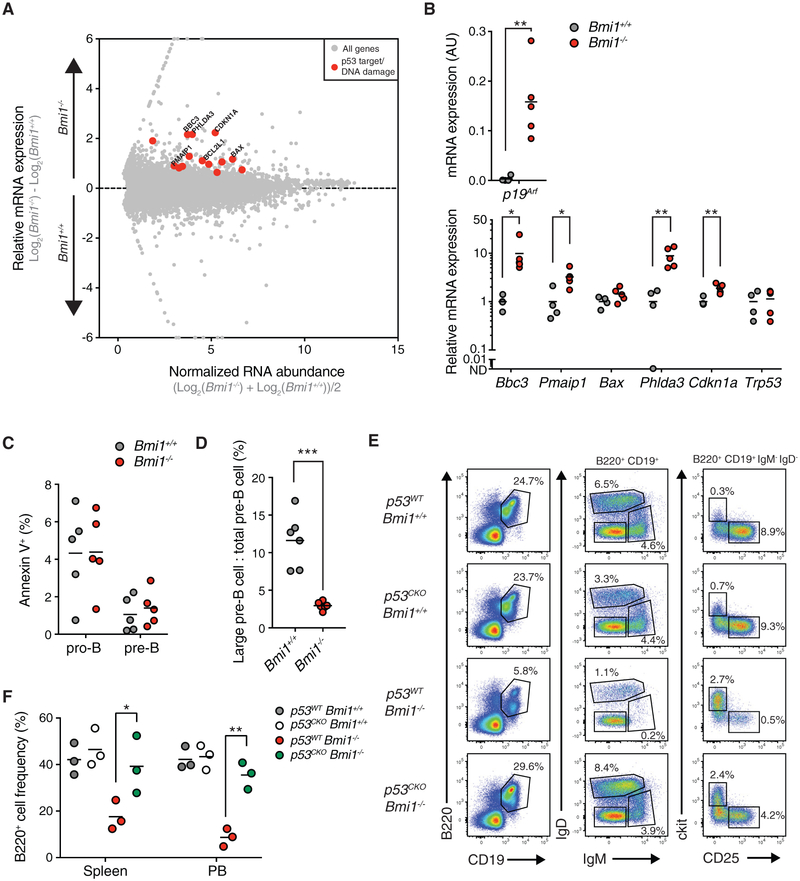
Figure 4. BMI1 Prevents the Upregulation of p53 Signaling and Maintains Large Pre-B Cell Cycling.
(A) RNA sequencing (RNA-seq) MA (log ratio and mean average) plot of Bmi1+/+ versus Bmi1−/− pro-B cells. Known targets of p53 are depicted in red.
(B) qRT-PCR expression analysis of indicated genes from sorted pro-B cells of indicated mice. Each point represents one animal; the line represents the mean. n = 4 for Bmi1+/+ animals; n = 5 for Bmi1−/− animals.
(C) Frequency of apoptotic (as indicated by annexin V positivity) pro-B cells and pre-B cells of indicated mice. Each point represents one animal; the line represents the mean. n = 5 for each genotype.
(D) Frequency of large pre-B cells present in the pre-B cell compartment of indicated mice. Each point represents one animal; the line represents the mean. n = 6 for each genotype.
(E) FACS plot of developing B cells in the bone marrow of indicated mice. Shown is the frequency of each cell population in the bone marrow of indicated animals. Representative of 3 independent experiments.
(F) Frequency of B220+ cells in the spleen and peripheral blood of indicated mice. Each point represents one animal; the line represents the mean. n = 3 for each genotype.
***p < 0.001, **p < 0.01, *p < 0.05. PB, peripheral blood.

