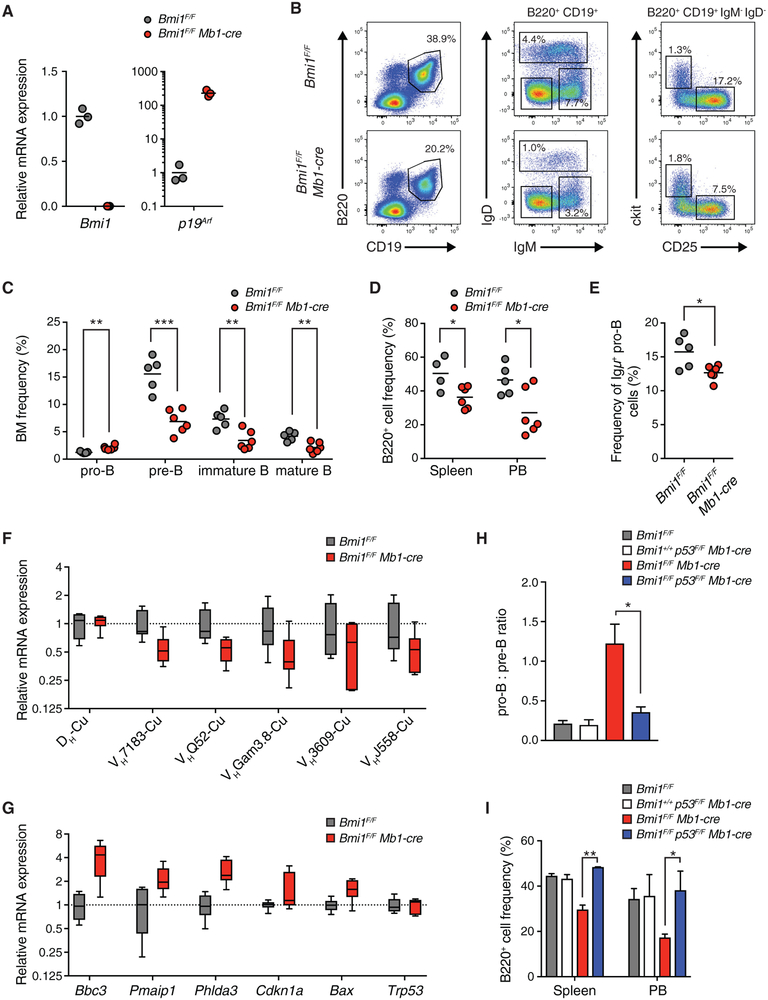
Figure 5. BMI1 Regulates the Pro-B Cell to Pre-B Cell Transition in a Cell-Autonomous Manner.
(A) mRNA expression levels as determined by qRT-PCR of indicated genes from pro-B cells of indicated mice. Each point represents one animal; the line represents the mean. n = 3 for each genotype.
(B) Representative FACS plot of developing B cells in the bone marrow of indicated mice. Shown is the frequency of each cell population in the bone marrow of indicated animals.
(C) Frequency of developing B cells in the bone marrow of indicated mice. Each point represents one animal; the line represents the mean. n = 5 for Bmi1F/F animals; n = 6 for Bmi1F/F Mb1-cre animals.
(D) Frequency of B220+ cells in the spleen and peripheral blood of indicated mice. Each point represents one animal; the line represents the mean. n = 4 for Bmi1F/F animals; n = 6 for Bmi1F/F Mb1-cre animals.
(E) Frequency of Igμ-positive pro-B cells in indicated mice. Each point represents one animal; the line represents the mean. n = 5 for Bmi1F/F animals; n = 6 for Bmi1F/F Mb1-cre animals.
(F) qRT-PCR analysis of gene expression of rearranged Igh genes in indicated mice. Data are shown as a box-and-whisker plot, with whiskers showing minimum and maximum values; the center line represents the median. n = 6 for each genotype.
(G) qRT-PCR expression analysis of indicated genes from sorted pro-B cells from indicated mice. Data are shown as a box-and-whisker plot, with whiskers showing minimum and maximum values; the center line represents the median. n = 6 for each genotype.
(H) Ratio of the frequency of pro-B cells to pre-B cells in the bone marrow of indicated mice. Data represent mean ± SEM; n = 3 for each genotype.
(I) Frequency of B220+ cells in the spleen and peripheral blood of indicated mice. Data represent mean ± SEM; n = 3 for each genotype.
**p < 0.01, *p < 0.05. BM, bone marrow; PB, peripheral blood.
See also Figure S5.

