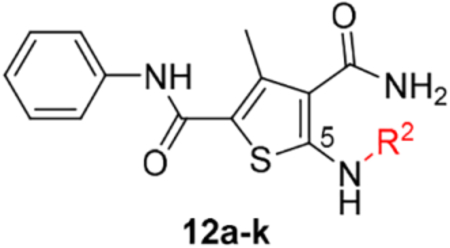
Table 1.
SAR around C-5 amino group.

| Compound | Structure | TSAa | EC50b (μM) | CC50c (μM) |
|---|---|---|---|---|
| 11 |  |
+++ | 3.4 ± 0.6 | >100 |
| 12a |  |
− | NTd | NT |
| 12b |  |
+ | ~10 | >100 |
| 12c |  |
+ | >10 | >100 |
| 12d |  |
+++ | 2.7 ± 1.9 | 49.5 ± 0.1 |
| 12e |  |
+++ | 1.4 ± 0.02 | >100 |
| 12f |  |
+++ | 4.7 ± 0.4 | >100 |
| 12g |  |
+++ | 4.1 ± 2.2 | >100 |
| 12h |  |
+ | 2.9 ± 0.7 | >100 |
| 12i |  |
+++ | 2.1 ± 0.3 | >100 |
| 12j |  |
+++ | 3.5 ± 2.1 | >100 |
| 12k |  |
− | NT | NT |
Thermal shift assay that measures changes in the thermal stability of HBV Cp upon binding of a small molecule: “−” denotes no binding, “+” weak binding, “++” moderate binding and “+++” strong binding.
Concentration of a compound inhibiting HBV total DNA production by 50%, expressed as the mean ± standard deviation from at least two independent experiments.
Concentration of a compound causing 50% cytotoxicity, expressed as the mean ± standard deviation from at least two independent experiments.
NT = not tested
