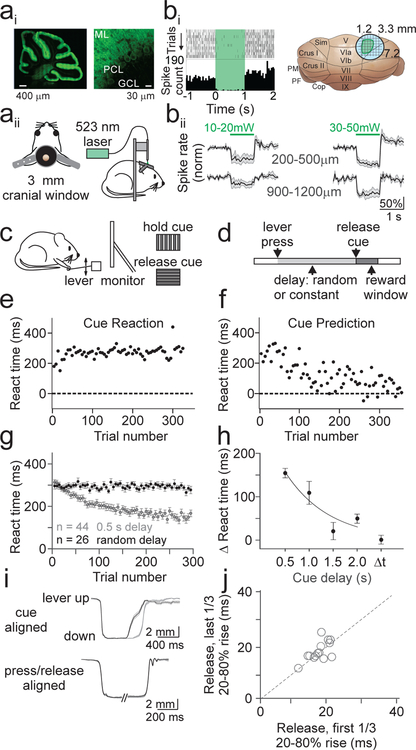
Figure 1.
Cerebellar sensorimotor task for head-fixed mice. Ai) Confocal image of a sagittal section from PCP2-Cre x Arch mouse showing expression of the inhibitory opsin Arch in PCs at low (left) and high (right) resolution. ML; molecular layer, PCL; Purkinje cell layer, GCL; granule cell layer. Aii) Schematics of a cranial window implanted over lobule simplex (left) and configuration for optogenetic stimulation (right). Bi) Left, representative single unit recording of PC simple spike raster (top) and spike rate histogram (bottom) aligned to onset of Arch activation (green shaded interval). Right, Location of the stimulation sites that evoked ipsilateral forelimb movements (green). Bii) Average normalized firing rates from superficial (top) or deep (bottom) PCs at low (left) or high (right) stimulation powers (n=5 mice; 10–20 mW – superficial: n=6 cells; deep: n=5 cells; 30–50 mW – superficial: n=10 cells; deep: n=4 cells). Note that the lower powers used to map motor responses were only sufficient to strongly suppress neurons above 500 μm. C) Schematic of configuration of behavioral task. Head-fixed mice were trained to release a lever in response to a visual cue, with reward delivered immediately upon correctly timed movement. D) Schematic of trial structure. The delay between lever press and release cue was either randomized (cue reaction) or constant (cue prediction) from trial to trial. E) Average reaction time (from cue onset) as a function of trial number for an example cue reaction session. Each point is the average of 5 trials. F) Same as E, for a cue prediction session. G) Summary of reaction times for all cue prediction sessions with a 0.5 s cue delay (gray; n=44 sessions, 10 mice) and all cue reaction sessions (black; n=26 sessions, 7 mice). Error bars are ±SEM across sessions. H) Summary of mean change in reaction time from the beginning to the end of cue prediction and reaction sessions (methods) (n =44 sessions, 0.5 s; n=9, 1.0 s; n=6, 1.5 s; n=30, 2.0 s; n=26, Δt). One-way ANOVA, main effect of cue delay, F=10.72, df=3. Error bars are ± SEM across sessions. I) Top, average lever kinematic traces from an example 0.5 s cue prediction session aligned to the cue show that lever releases occur sooner in the last 1/3 of trials (black, n=149) as compared to the first 1/3 of trials (gray, n=149). Shaded area is ±SEM across trials. Bottom, same example session as above aligned separately to press and release showing no difference in kinematics from beginning (gray) to end (black) of the session. J) Summary of average lever release times (20–80% rise time) across sessions (n=15 sessions, 4 mice)

