Figure 3.

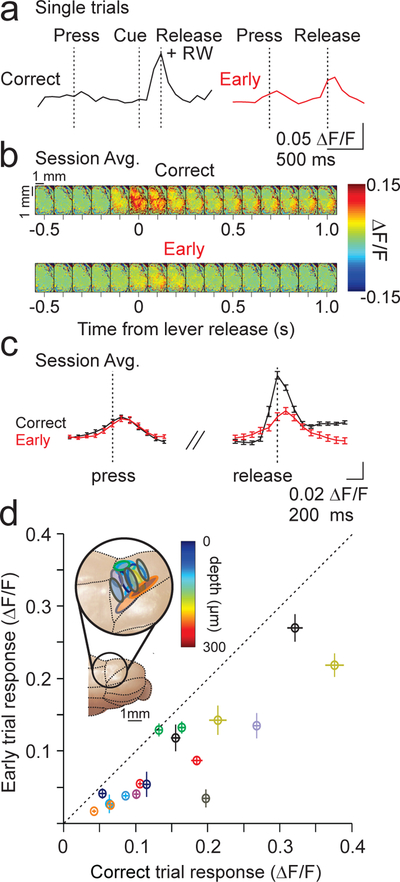
Single photon imaging during cue reaction sessions. A) Example ΔF/F single trial timecourses for a correctly timed lever release (left) and an early lever release (right). RW = reward, delivered immediately on correct release. B) Field of view (images separated by 100 ms) showing the average fractional change in fluorescence aligned to lever release for correct (top) and early (bottom) trials from an example session (same session as example from A). C) Calcium transient timecourses averaged across 87 trials from the experiment in A. B) for correct (black) and early trials (red). Error bars are ±SEM across trials. D) Summary of the mean peak calcium transients (measured on single trial basis, methods) for all correct and early trials across sessions (n=10 animals, 17 sessions). Colors represent different animals, and each point represents an imaging session. Note that all points lie below the diagonal. Inset, schematic of ROIs for all sessions. Outline color corresponds to mouse from scatter plot, and fill color indicates imaging depth identified by post-hoc histology. Error bars are ± SEM across sessions.
