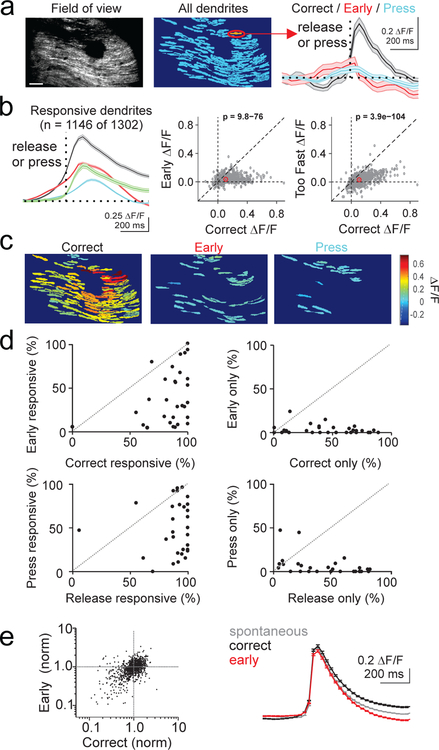
Figure 5.
Complex spiking produces larger mean response in individual dendrites and enhanced population responses when movement is correctly timed. A) Left, average GCaMP fluorescence from an example 2-photon imaging session (30 Hz acquisition rate). Scale bar = 100 μm. Middle, pixel mask of individual PC dendrites extracted from the same session. Right, average calcium responses measured from the highlighted dendrite segregated by trial event (n=186 trials). Dotted line represents time of lever press (blue) or lever release (correct: black; early: red). Shaded area is ±SEM across trials. B) Left, average timecourse of calcium response for all significantly responsive dendrites aligned to lever press (blue), or release (correct releases (black), early releases (red), and too-fast releases (green) that occurred < 200 ms following the visual cue; n=17 animals, 30 sessions, 1146 dendrites). Shaded area is ±SEM across dendrites. Middle, summary scatter plot comparing the average peak amplitude of the calcium transient for each significantly responsive PC dendrite (gray) and the average of all dendrites (red) for correct and early release trials. P-value from paired t-test. Right, same as middle for correct and too fast release trials. P-value from paired t-test. C) Pixel masks of dendrites significantly responsive to lever release on correct trials, lever release on early trials, and lever press for the example session in A. Color map represents average ΔF/F. D) Summary across experiments of the fraction of dendrites responsive to correct lever releases vs early releases (top, left), to only correct or only early releases (top, right), to lever press vs release (bottom, left), and only to press or release (bottom, right). Responses were categorized as significant (p<0.05) according to a one-tailed t-test (methods). E) Left, average amplitude of correct and early release-evoked calcium events for all dendrites normalized to the amplitude of spontaneous calcium events. One-way ANOVA, F=1.8, df=2. Right, mean spontaneous (gray, n=286,964 events, 1146 dendrites) and correct (black, n=19,550 events, 1146 dendrites) and early (red, n=9,167 events, 1146 dendrites) release lever-evoked calcium events across all responsive dendrites. Error bars are ±SEM across dendrites.

