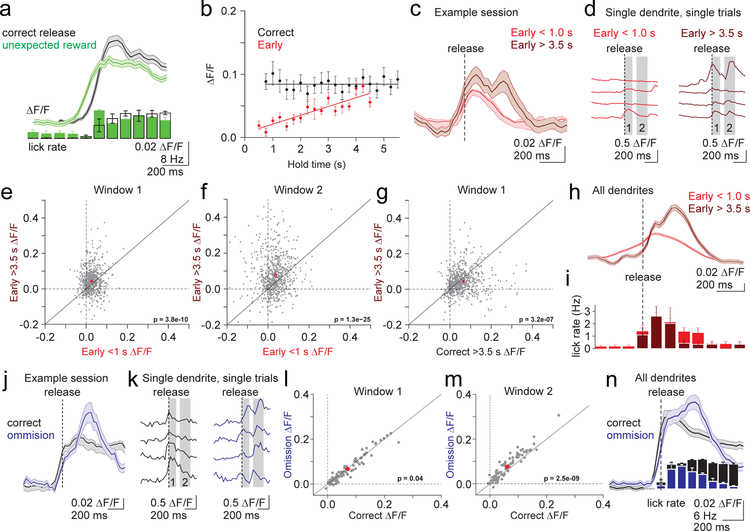
Figure 8.
Complex spiking is modulated by learned sensorimotor predictions. A) Top, Average calcium transient in response to unexpected reward (green, aligned to first lick) and correct lever releases (black, aligned to release). Shaded error is SEM across dendrites (n=120). Bottom, Average lick rate for unexpected reward and correct lever releases. Error is SEM across sessions (n=3). B) Summary of the mean peak calcium transients in a 500 ms window at the time of release (methods) across all 2-photon experiments for correct (black) and early (red) release trials binned according to hold time (250ms bins). Linear fits were applied to data from each trial type (n=17 animals, 30 sessions). Error bars are SEM across sessions. C) Mean timecourse of calcium transients for an example session (n=43 dendrites) divided according to early trials with hold durations of < 1.0s (red) and > 3.5s (dark red). Note the late, second response for long hold duration trials. Shaded error is SEM across dendrites. D) Single trial example timecourses from an individual dendrite from the session in C. Gray bars represent analysis windows for subsequent plots E-G) Summary of peak calcium transients measured in the shaded windows from D for all dendrites (n=1146) according to lever hold time (E,F) and trial outcome (G). P-values represent paired t-tests. H) Mean calcium transient timecourses averaged across all dendrites (n=1146) on short and long hold early release trials. Shaded error is SEM across dendrites. I) Mean lick rates for the subset of experiments where licking was measured in H (n= 6 animals, 10 sessions)). Error bars are SEM across sessions. J) Example timecourses of mean calcium transients from a single session (n=22 dendrites) for correct (black), and reward omission (dark blue) trials. Note the late, second response on omission trials. Shaded error is SEM across dendrites. K) Single trial example timecourses from an individual dendrite from the session in J. L-M) Summary of peak calcium transients measured in the shaded windows in K on correct and reward omission lever trials (n=81 dendrites, 3 animals, 3 sessions). P-values represent paired t-tests. N) Mean timecourses of calcium transients averaged across all dendrites (n=81) for correct (black) and reward omission (dark blue) trials. Vertical bars represent the lick rate averaged across trials for all reward omission sessions. Shaded error is SEM across dendrites. Error bars are SEM across sessions.

