FIGURE 2.

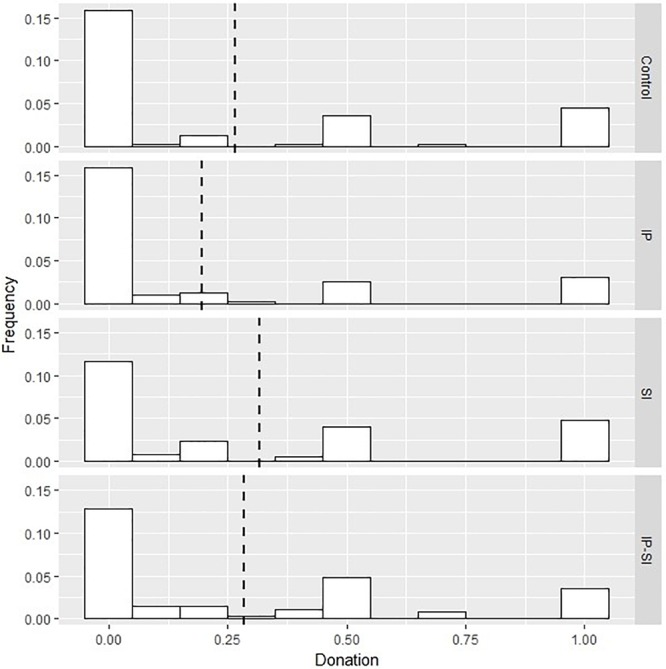
Distribution of donation per experimental condition, Study 1. IP, identity priming; SI, social information; IP – SI, identity priming and social information. Dashed line represents mean value.

Distribution of donation per experimental condition, Study 1. IP, identity priming; SI, social information; IP – SI, identity priming and social information. Dashed line represents mean value.