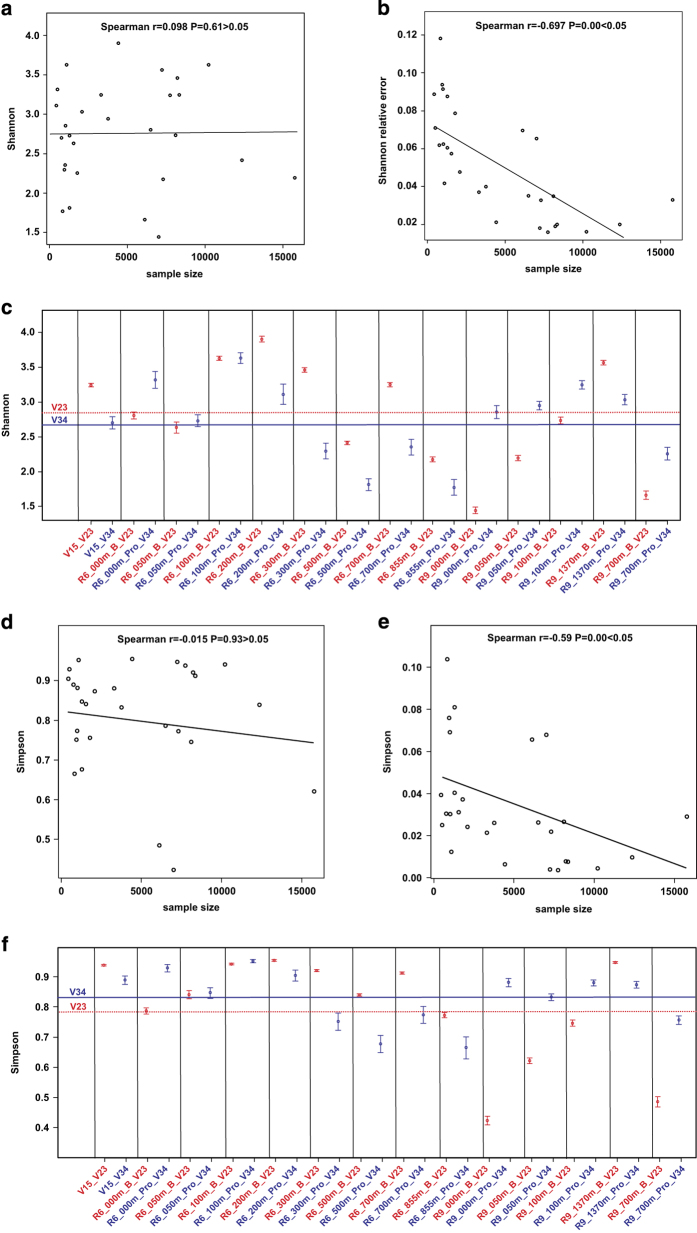
Figure 1. Comparative analysis of indices Shannon and Simpson.
(a) Dependence of the Shannon index from the sample size for V2-V3 and V3-V4 16S rRNA fragments. (b) Dependence of the Shannon relative error from the sample size for V2-V3 and V3-V4 16S rRNA fragments. (c) The per-sample Shannon indices, point bars indicate 95% CI, red line – average value for V2-V3 fragments, blue line – average value for V3-V4 fragments. (d) Dependence of the Simpson index from the sample size for V2-V3 and V3-V4 16S rRNA fragments. (e) Dependence of the Simpson relative error from the sample size for V2-V3 and V3-V4 16S rRNA fragments. (f) The per-sample Simpson indices, point bars indicate 95% CI, red line – average value for V2-V3 fragments, blue line – average value for V3-V4 fragments. V2-V3 fragments 16S rRNA – red pointer, V3-V4 fragments – blue pointer. The encoding of the samples is indicated in Table 1.

