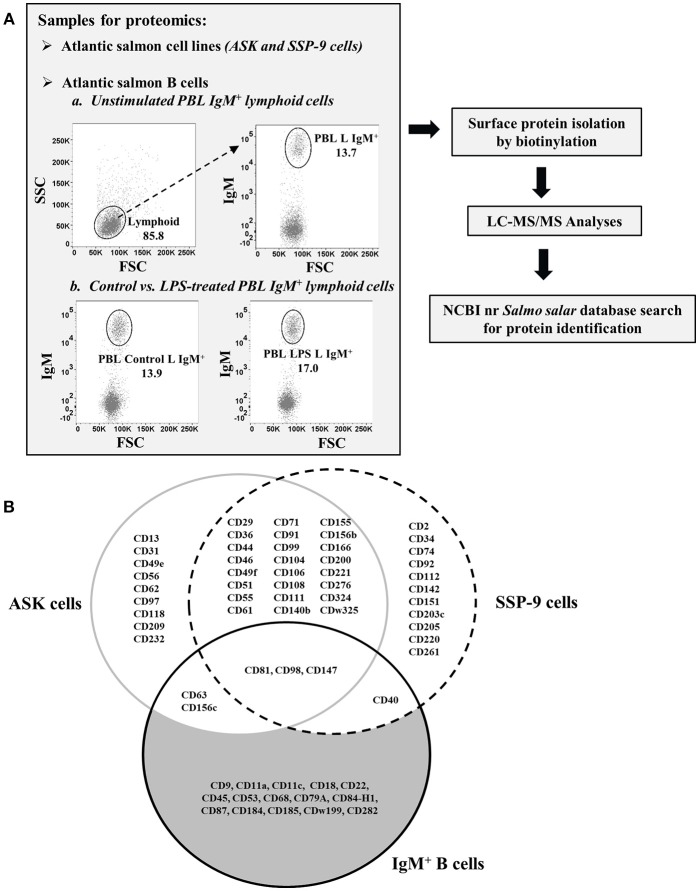
Figure 1.
Isolation and identification of CD molecules on surface of Atlantic salmon B cells and head kidney cell lines. (A) Schematic diagram of proteomics workflow performed in the study. (B) Venn diagram comparing the CD molecules detected on cell surface of sorted IgM+ PBLs vs. head kidney cell lines, ASK and SSP-9, of Atlantic salmon.

