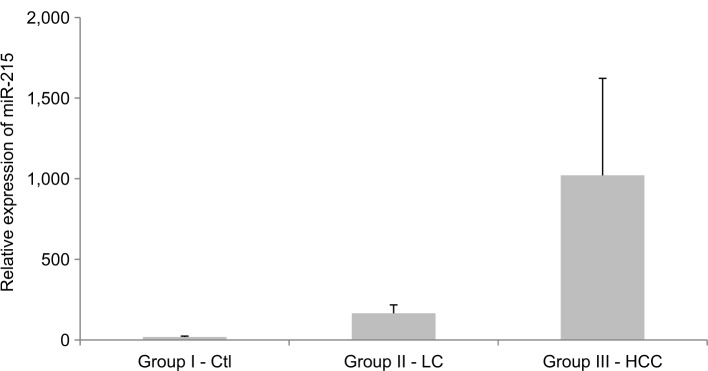
Figure 2.
The relative miR-215 expression levels among the studied groups.
Notes: Expression levels were detected using qRT-PCR assay. Relative expression was analyzed by ∆Ct method using SNORD68_11 as reference gene. The values are presented as mean±SD.
Abbreviations: Ctl, control; HCC, hepatocellular carcinoma; LC, liver cirrhosis; qRT-PCR, quantitative real-time PCR.

