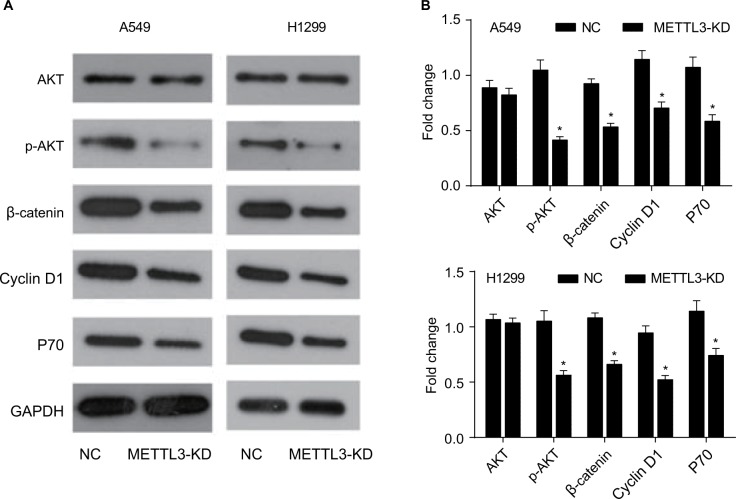
Figure 6.
Knockdown of METTL3 induced apoptosis through the AKT signaling pathway.
Notes: (A) The expression of AKT pathway related proteins was analyzed by Western blot. (B) The values of the band intensity represent the densitometry estimation of each band normalized to GAPDH. Experiments in this figure were all performed in triplicate (*P<0.05).

