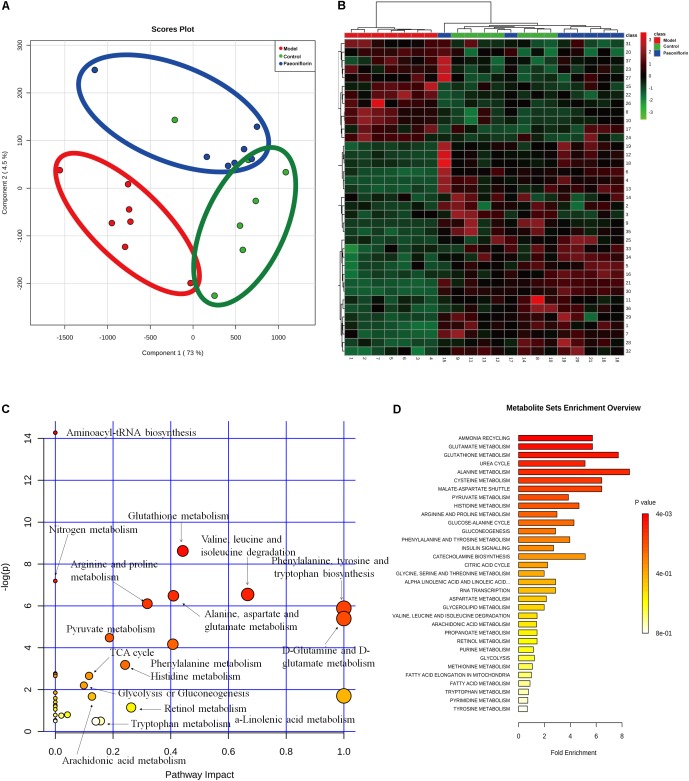
FIGURE 3.
Metabonomic analysis results of paeoniflorin-treated OVA-induced allergic asthma mice. Score plots from the PLS-DA model (A) and heatmap (B) classifying the control group (Green), model group (Red), paeoniflorin group (Blue) with mice lung samples by UPLC-Q-TOF/MS. Metabolites set enrichment results was shown in C and D.

