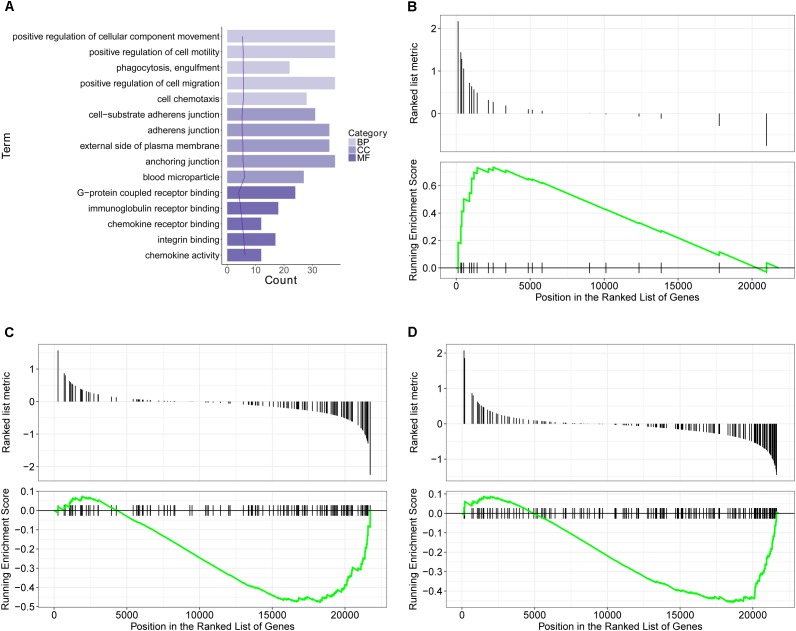
FIGURE 4.
Transcriptomics analysis of OVA on normal mouse. (A) GO enrichment analysis of DEGs between Model and Control in BP (Biological process), MF (Molecular function) and Cellular Component (CC). (B–D) GSEA analysis of DEGs between Model and Control: (B) mmu05310: Asthma; (C) mmu04371: Apelin signaling pathway; (D) mmu04022: cGMP-PKG signaling pathway.

