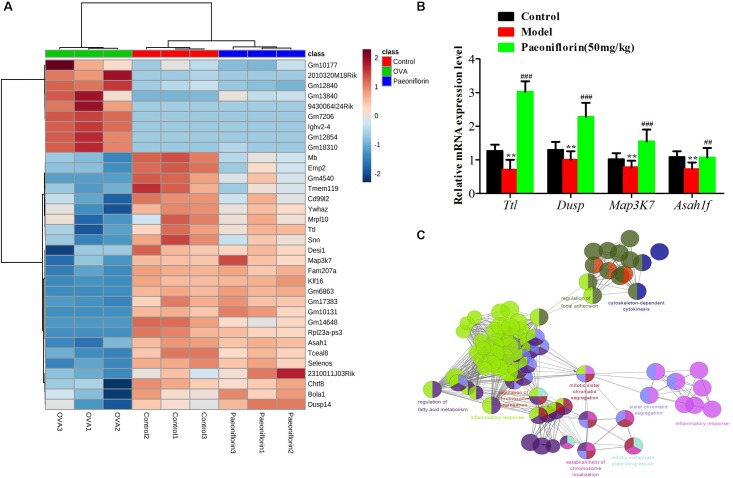
FIGURE 6.
The enrichment analysis of candidate genes of paeoniflorin on allergic asthma model mouse. (A) Heatmap classifying the candidate genes of paeoniflorin on allergic asthma model mouse. (B) mRNA expression level of Ttl, Dusp, Map3k7 and Asah1f was detected by real-time PCR assay. (C) The genes were mainly related to such biological functions: fatty acid metabolism, inflammation response, cytokinesis, chromosome and adhesion plaque. The data were expressed as the mean ± SD. ∗Means control group vs model group (∗p < 0.05, ∗∗p < 0.01, and ∗∗∗p < 0.001); #Means model group vs paeoniflorin group (#p < 0.05, ##p < 0.01, and ###p < 0.001).

