
Figure 1. Strategy for Assessing the Relationship between UCEs and Domains, Boundaries, and Loop Anchors.
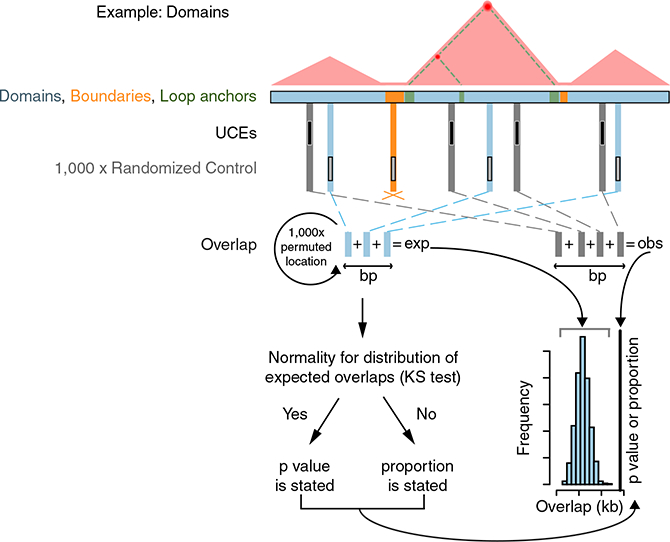
We assess the relationship of UCEs (black) to domains (blue), boundaries (orange), and loop anchors (green) via a multi-step process, illustrated here with respect to domains. Throughout this and other figures, blue, orange, and green refer to analyses related to domains, boundaries, and loop anchors, respectively. First, overlaps between UCEs and all domains in a dataset are summed to produce the observed overlap; as this example concerns domains, overlap between UCEs and boundaries are not tallied (orange cross). The observed overlap is then compared to a distribution of expected overlaps generated from the overlap of domains with each of 1,000 sets of control genomic sequences, matched to UCEs in number and length and randomly positioned in the genome. Finally, the distribution of the resulting 1,000 control overlaps is tested for normality using the Kolmogorov-Smirnov (KS) test, and when normality is observed, a Z-test p value is reported to describe the significance of the deviation of the observed overlap from the distribution of expected overlaps. If normality is not observed, the proportion of expected overlaps equal to, or more extreme than, the observed overlap is stated. See also Table S1 and S2.