
Figure 2. UCEs Are Enriched in Pooled Domains, Depleted from Pooled Boundaries, and Indifferent to Pooled Loop Anchors.
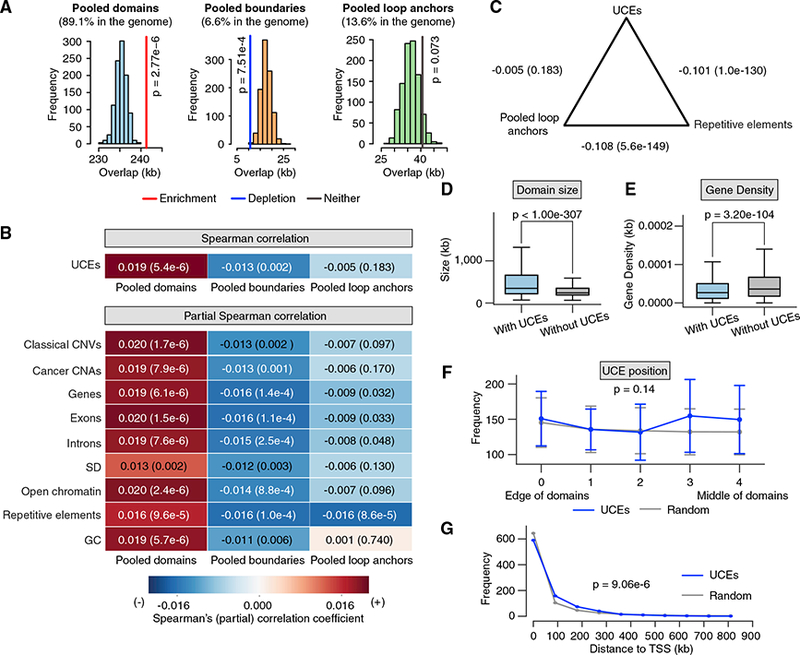
(A) In thecaseofpooled domains, theobserved overlap (colored vertical line) ofUCEs is significantlygreaterthanthe expected overlaps(red line; p = 2.76 × 10⁻⁶, obs/exp = 1.025). For pooled boundaries, the observed overlap is significantly below expectation (blue line; p = 7.51 × 10⁻⁴, obs/exp = 0.609). Observed overlap between UCEs and pooled loop anchors does not deviate significantly from expectation (gray line; p = 0.073, obs/exp = 1.124). Note that pooled domains may include pooled boundaries, because the boundaries of some cell types may be organized as domains in other cell types.
(B) Correlation analyses. Spearman correlation: using pairwise Spearman correlation and splitting the genome into 50-kb bins, the representation of UCEs is positively correlated with that of pooled domains (p = 5.4 × 10⁻⁶), negatively correlated with that of pooled boundaries (p = 0.002), and not significantly correlated with that of pooled loop anchors (p = 0.183). Partial Spearman correlation: the positive and negative correlations between the positions of UCEs and pooled domains (first column), and negative correlation between the positions ofUCEsand pooled boundaries (second column) remain significant even after accounting forthe correlation between the positions of UCEs and nine control genomic features. The representation of UCEs and pooled loop anchors (third column) is not significantly positively nor negatively correlated except when controlling for repetitive elements, explored in (C).
(C) Although UCEs and pooled loop anchors are not significantly correlated with each other (p = 0.183), pairwise correlation analyses of both UCEs and pooled loop anchorsshowahighlysignificant negative correlation with repetitiveelements (p=1.0 × 10−130 and p = 5.6 × 10−149, respectively). In (B) and (C), Spearman (partial) correlation coefficients are reported in each box and by a heatmap; p values are reported in parentheses.
(D and E) Domains containing UCEs are significantly larger (D) (p <1.00 × 10−307) and relatively gene sparse (E) (p = 3.20 × 10−104) as compared to domains without UCEs. p values were calculated by Mann-Whitney U test; box: interquartile range; whisker: 1.5 x interquartile range.
(F) UCEs are positioned roughly evenly across domains, with the distribution differing insignificantly from expectation (p = 0.14; K-S test; error bar: SD).
(G) UCEs are positioned further than expected from the nearest transcription start site (TSS) (p = 9.06 × 10⁻⁶; Anderson-Darling test).