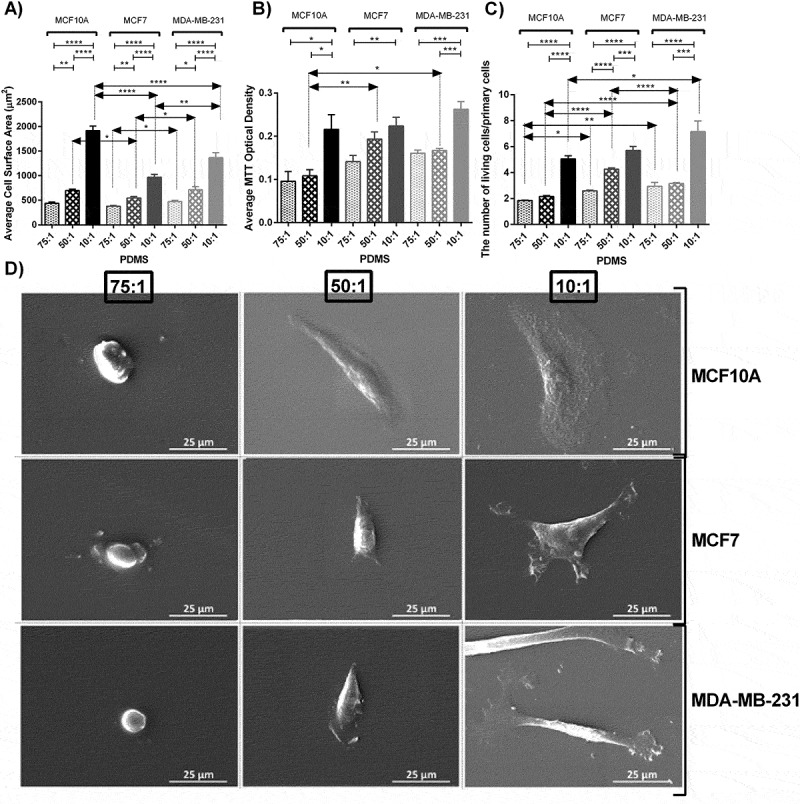
Figure 1.

Morphological analysis, proliferation assay and SEM images of MC10A, MCF7 and MDA-MB-231 cell lines cultured on substrates with different elastic moduli. A) Average cellular surface area of different breast cell lines cultured on substrates with different rigidities using Image J software. B) Average cellular proliferation index of different breast cell lines cultured on substrates with different rigidities using MTT assay. C) Direct living cell counting using trypan blue. The number of cells after 48 h culture was divided by the number of primary cells (50,000 cells in each well of 6 well plates in the first day of culture) . D) Scanning electron microscopic (SEM) images of different breast cell lines cultured on substrate with different rigidities. In each case, values represent the mean (± SEM) of measurements from three independent experiments (*P < 0.05, **P < 0.01, ***P < 0.001 and ****P < 0.0001).
