
Figure 4.
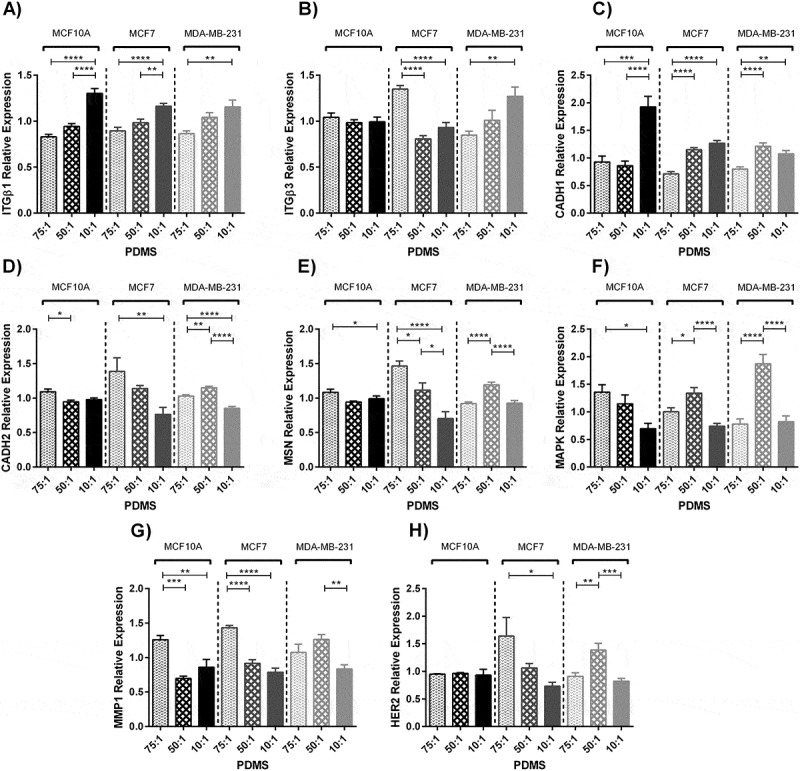
Quantification of gene expression of three breast cell lines cultured on prepared substrates with different rigidities for 2 days using real time PCR. (A, B, C, D, E, F, G, H) Represents relative gene expression of different breast cancer cell lines cultured on substrates with different elastic moduli. (A) Integrin β1. (B) Integrin β3. (C) E-cadherin. (D) N-cadherin. (E) Moesin. (F) Mitogen-activated protein kinase 1. (G) Matrix metalloproteinase1. (H) Human epidermal growth factor receptor 2. In each case, values represent the mean (± SEM) of quantification in three independent experiments (*P < 0.05, **P < 0.01, ***P < 0.001 and ****P < 0.0001).