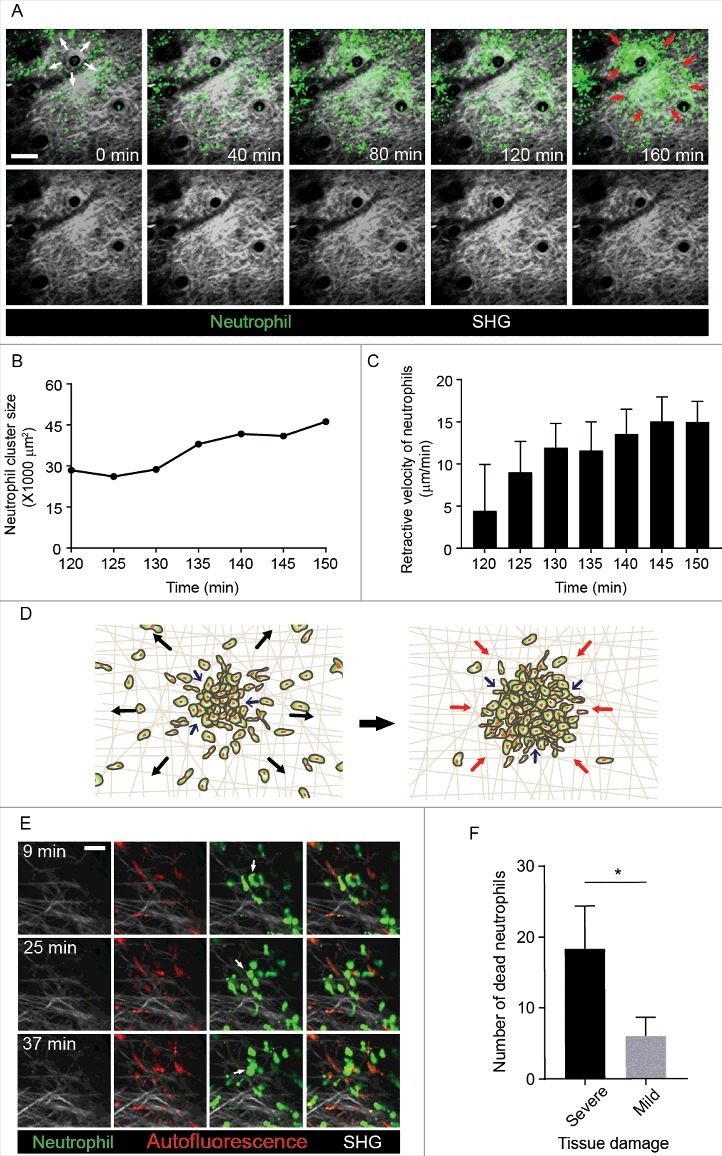
Figure 2.

Neutrophil cluster enforced out-migrating neutrophils to draw back to the original residence (A) Neutrophils formed clusters in non-inflammatory conditions. Two phases of neutrophil migration were observed. In the first 120 min, circulating neutrophils migrated out along the tissue from the initial site, as indicated by the white arrows; after 120 min, neutrophils quickly moved back and formed massive cluster units. Red arrows represent the regressive neutrophils migrating towards the initial site. Scale bar, 100 μm. The images were representative of three independent videos. (B) Graph showing the correlation between cluster area size and time during retraction of neutrophils to the initial site in each time point. (C) Graph showing retraction velocity of neutrophils in each time point. (D) Illustration of neutrophil migratory pattern based on Video 5. (E) Images of neutrophils (green), autofluorescence structure (red), and SHG (grey) are represented. Arrows symbolize neutrophil death. Scale bar, 30 μm. The images were representative of five independent videos. (F) Comparison of cell death rates on autofluorescence and collagen structures. *P = 0.035. Images and data are representative of at least 3 independent experiments.
