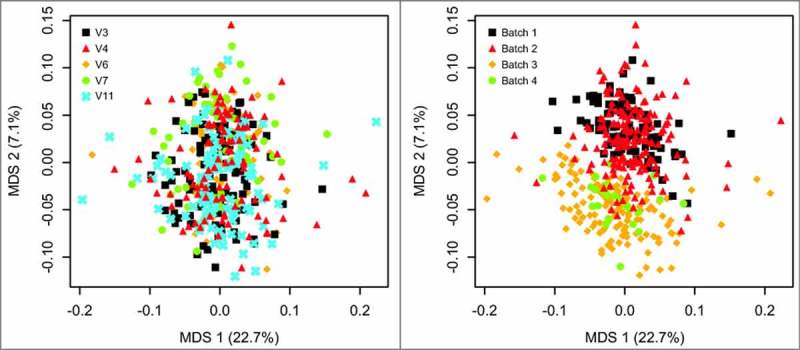
Figure 2.

Multidimensional scaling (MDS) ordination at the family level for all samples colored by visit (left panel) and batch (right panel). Batch 1 and batch 2 show substantial overlap, as do batch 3 and batch 4. Tests from 9999 ADONIS permutations yielded a significant difference (p = 0.016) for V3 vs V4 and the effect of patient (p < 0.0001), but a non-significant difference between V3 and V11 (p = 0.0752).
