
Figure 2.
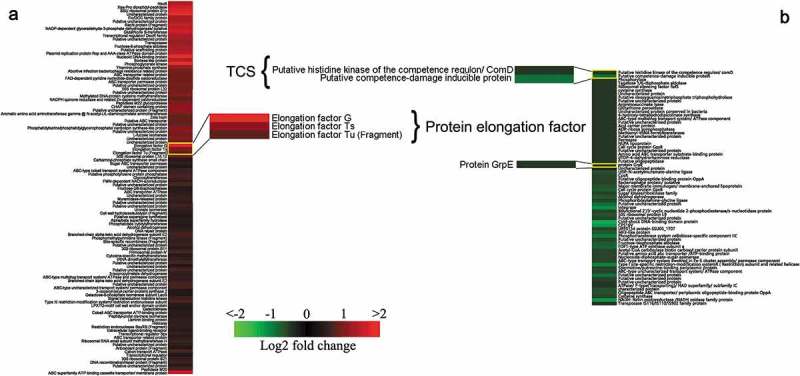
K-means clustering representation of 171 profiles of Streptococcus suis with up-regulations (a) and down-regulations (b). The magnitude of the percentage is represented by a color scale (top right) going from low (green) to high (red).
Official websites use .gov
A
.gov website belongs to an official
government organization in the United States.
Secure .gov websites use HTTPS
A lock (
) or https:// means you've safely
connected to the .gov website. Share sensitive
information only on official, secure websites.
K-means clustering representation of 171 profiles of Streptococcus suis with up-regulations (a) and down-regulations (b). The magnitude of the percentage is represented by a color scale (top right) going from low (green) to high (red).