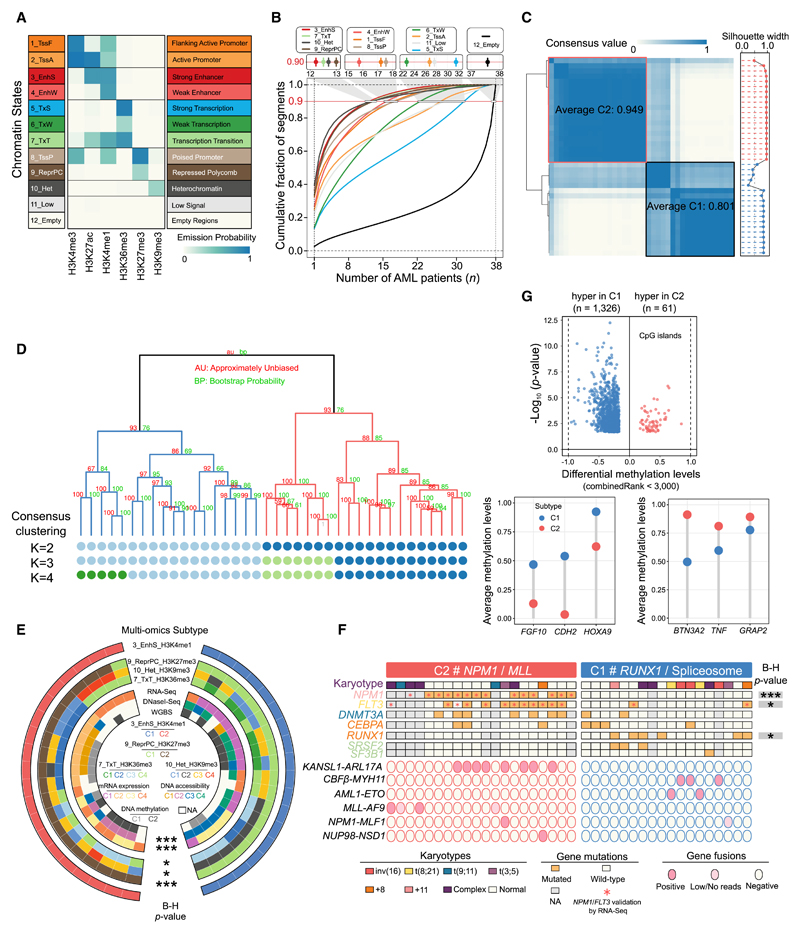
Figure 1. Chromatin State Definition and Subtype Assignment across AMLs.
(A) Combinatorial patterns of 6 histone marks in a 12-state model. The emission probability was learned from ChromHMM based on spatial patterns of histone modifications in chromatin and used to define the chromatin state. A darker shade of blue indicates greater enrichment of the profiled histone marks in a particular state.
(B) Dynamic patterns of chromatin states. The lines indicate genome coverage fraction of each state consistently labeled with that state in at most n (n = 1–38) samples. Approximately 90% of genomic bins with the EnhS state could be found in a small subset of at most 12 samples, and only 1% were commonly shared among 24 or even more samples. In contrast, the quiescent regions labeled as Empty state were the most constitutive, with 65% consistently marked among ≥30 samples, and the fraction of this state uniquely detected in 1 sample was <3%.
(C) Consensus matrices (left) and silhouette scores (right) of 38 AML samples using H3K4me1 signals in strong enhancer state. Consensus values range between 0 (highly dissimilar profiles) and 1 (highly similar profiles), colored white to dark blue. The average consensus score for each subtype is shown in the box.
(D) Hierarchical epigenome clustering of the same data using the pvclust package. Values on the branch indicate bootstrap support scores >1,000 samplings using 2 different approaches. The dots below the dendrogram reveal consensus clusters for k = 2–4. The 3-cluster classification did not split the intermediate box (in Figure 1C) but another subgroup from C2, which could be matched with cluster results from the pvclust method.
(E) Comparison of AML classification on the basis of different datasets. Statistical significance of overlap among multiple clusters is assessed by Fisher’s exact test, followed by the Benjamini-Hochberg (B-H) correction. ***p < 0.001 and *p < 0.05.
(F) Mutation profiles in the 2 AML subtypes. All of the patients with NPM1 insertion and FLT3-ITD were validated by RNA-seq data, as well as all of the translocation fusion products. The strength of association between each mutation and subtypes is assessed by Fisher’s exact test followed by the B-H correction. *p < 0.05, **p < 0.01, and ***p < 0.001.
(G) Differential methylation profiles at global CpG islands between 2 subtypes. A CpG site with combined rank score <3,000 was considered significant.
See also Figures S1, S2, and S3 and Tables S1, S2, S3, S4, and S5.

