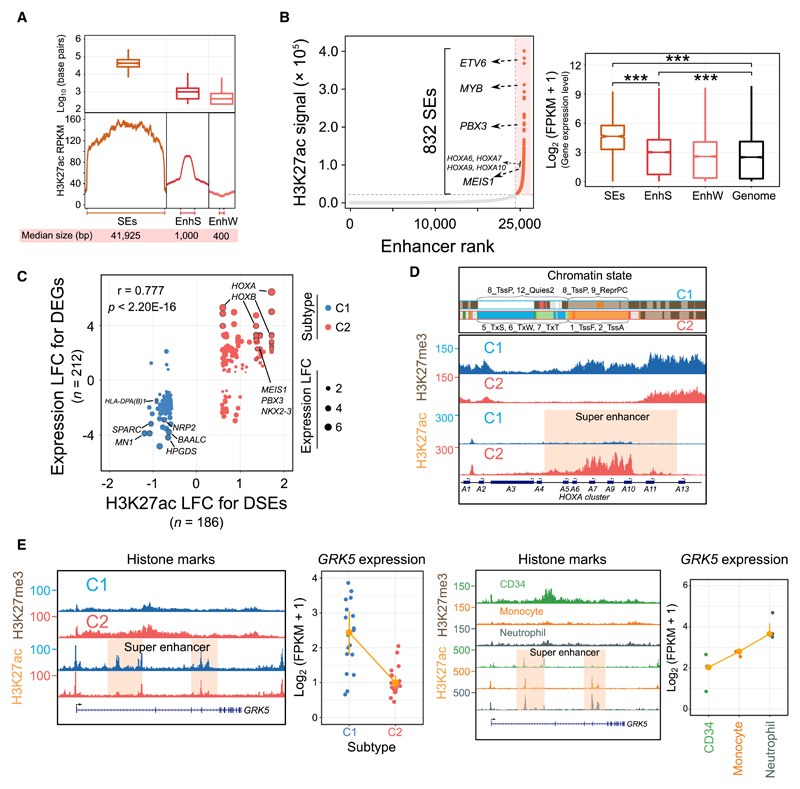
Figure 2. Genome-Wide Landscape and Subtype-Specific Features of Super-Enhancers.
(A) The genomic length and H3K27ac intensity of SEs in AML. EnhS, strong enhancer state; EnhW, weak enhancer state; SE, super-enhancer.
(B) Ranked enhancer plots and their regulatory effects in a representative sample. SEs are orange, and several known AML-associated genes proximal to SEs are highlighted. The figure at right shows the expression differences of genes associated with different types of enhancers. ***p < 0.001.
(C) Correlation between differentially expressed genes (DEGs) and differentially regulatory SEs (DSEs). A total of 212 deregulated genes were assigned to 186 DSEs within a 1-Mb distance. LFC, log2 fold change.
(D) Chromatin states H3K27ac and H3K27me3 signal at the HOXA cluster loci in 2 AML subtypes. For each 200-bp bin from ChromHMM segmentation analysis, we selected the most frequent chromatin state to show in each subtype. All y axis scales are reads per kilobase million (RPKM)-normalized units.
(E) Dynamic H3K27ac and H3K27me3 intensity and expression levels of the GRK5 gene in AML patients, normal CD34+ progenitors, monocytes, and neutrophils.
See also Figure S4.

