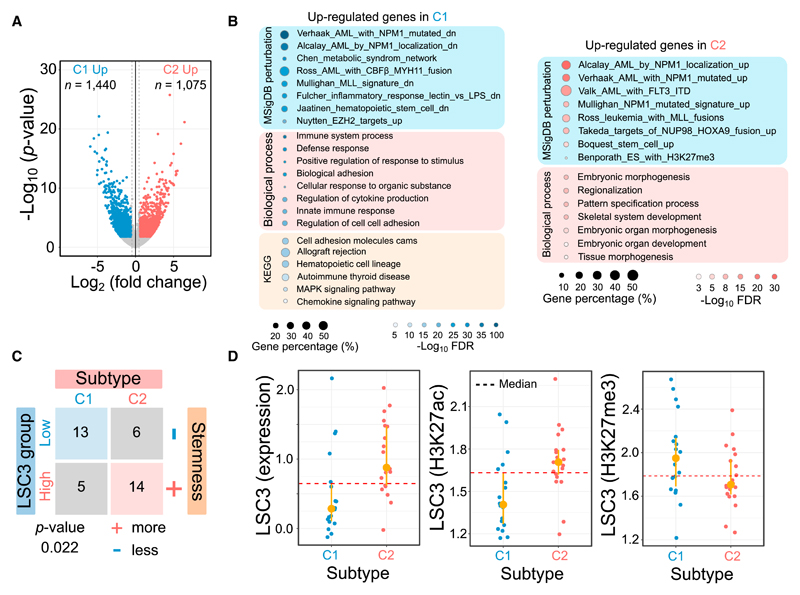
Figure 3. Subtype-Specific Transcriptomic Signatures.
(A) Volcano plot of gene expression changes between 2 subtypes.
(B) Functional enrichment analysis for differentially expressed genes. The dot size represents the percentage of identified genes against background.
(C) Contingency table comparing putative AML subtypes with different cellular consequences in prognosis predicted from a 3-gene signature model. All AML samples were partitioned into 2 groups based on the LSC3 median cutoff. Samples with higher LSC3 score have greater stemness properties.
(D) Leukemic stem cell score derived from 3 signature genes using gene expression, H3K27ac, and H3K27me3 for the 2 subtypes. The H3K27me3-dependent LSC3 score shows opposite trend due to negative regulation with gene expression.

