
Figure 7.
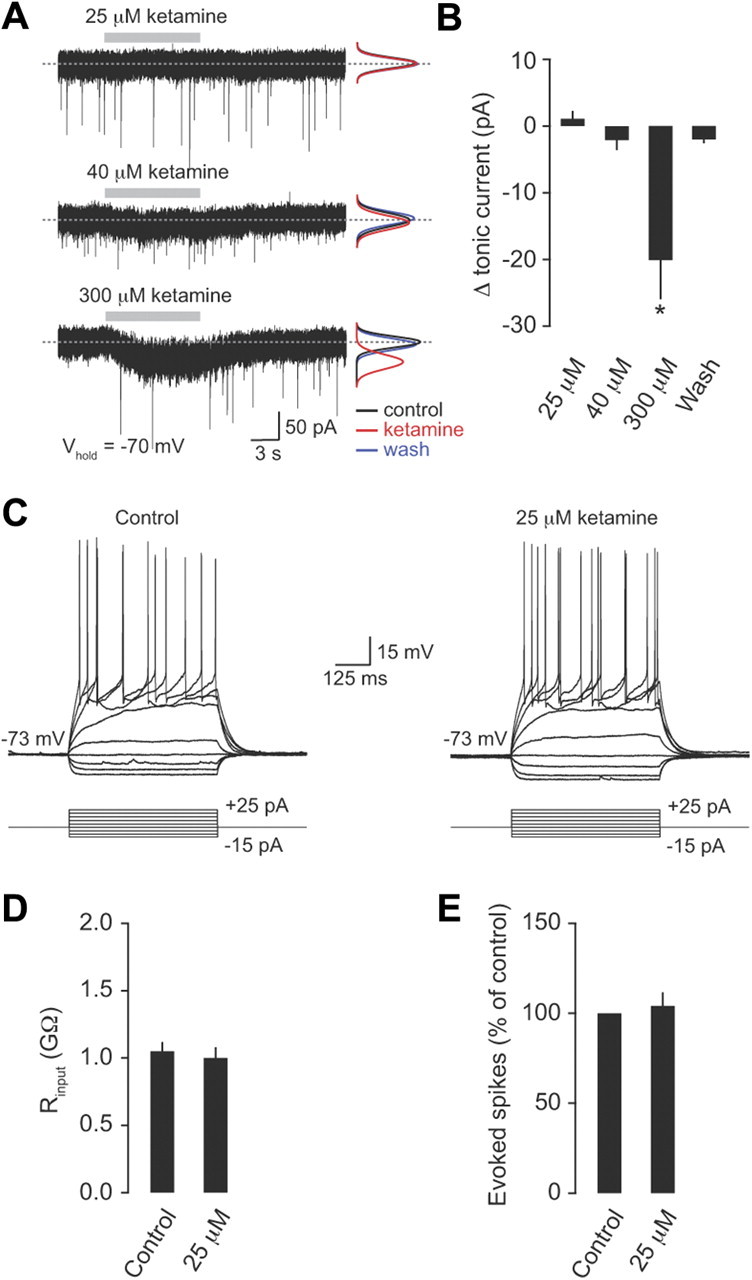
Low concentrations of ketamine do not affect tonic inhibition or granule cell excitability. A, Tonic GABA currents recorded from granule cells at −70 mV in control and in the presence of ketamine (25, 40, and 300 μm). The black, red, and blue lines are Gaussian fits to all-point noise histograms recorded during control, ketamine application, and washout, respectively. B, Mean change in tonic current (pA) in the presence of 25, 40, and 300 μm ketamine (n = 6, 4, and 4, respectively). C, Representative voltage recordings during a current injection protocol (−15 pA to +25 pA in increments of 5 pA) in control and in the presence of 25 μm ketamine. D, Average granule cell input resistance (Rinput) in the absence and presence of 25 μm ketamine (n = 4). E, Average change in the number of evoked spikes in response to a 20 pA steady-state current injection in the presence of 25 μm ketamine (percentage of control; n = 4).