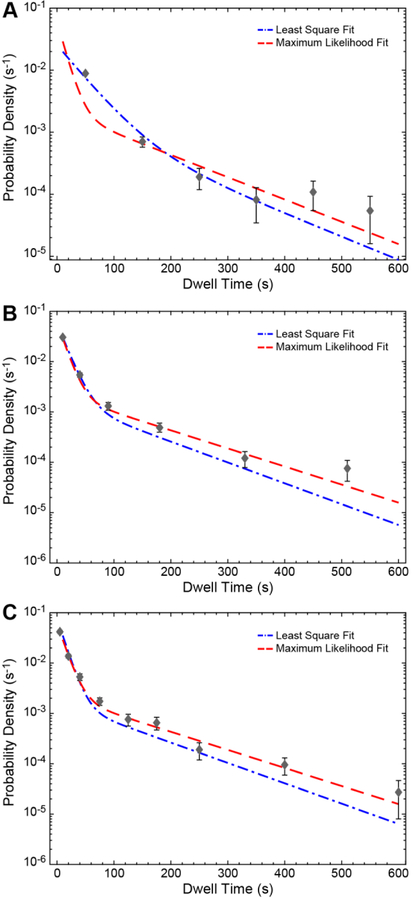
Figure 3.
Bin size-dependent comparison between ML and least squares fits of dwell time distributions. The probability density histograms for the dwell times of BBP on WT RNA with (A) 6, equally-sized bin widths, (B) 6, variably-sized bind widths, and (C) 9, variably sized bin widths. Lines represent the fits to the bin centers (black points) using least squares methods (blue) or fits of the unbinned data using ML methods (red). For both methods, the fit parameters and their corresponding confidence intervals are given in Tables 1 and 2.

