
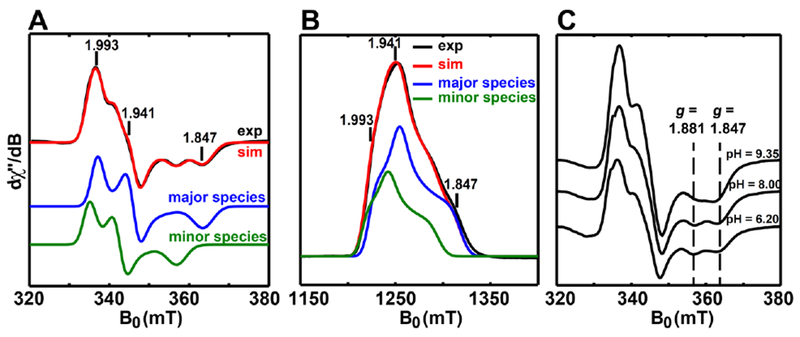
Figure 2. EPR characterizations of the paramagnetic intermediate.
A, X-band (9.38 GHz) CW EPR spectra of the intermediate recorded at 40 K with 100 mW power. B, Q-band (34.0 GHz) electron spin-echo detected field swept EPR spectrum of the intermediate at 10 K. The pulse sequence was π/2-τ-π-τ-echo, with π/2 = 16 ns and τ = 300 ns. The black traces are experimental spectra, while the red traces are the simulated spectra involving the contributions from both the major component (64%, g-tensor = [1.993, 1.941, 1.847], blue traces) and the minor component (36%, g-tensor = [2.005, 1.960, 1.881], green traces). C, pH-dependence of X-band CW EPR spectra of the paramagnetic intermediate recorded at 40 K with 100 mW power. The buffer was 100 mM Tris-HCl, 10 mM KCl and 10 mM DTT, with pH = 6.20, 8.00 or 9.35.