
Figure 3. Orientation-selected Q-band ENDOR spectra of the paramagnetic intermediate with magnetic nuclei (57Fe and guanidino-15N2) incorporated in the BioB enzyme.
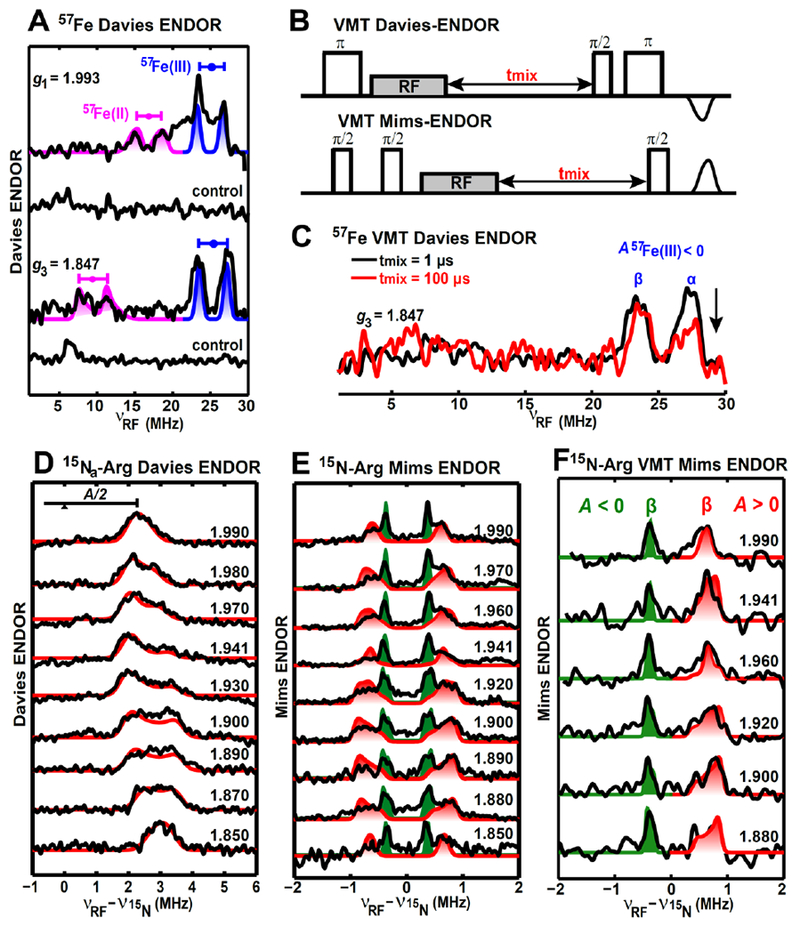
A, Q-band Davies-ENDOR spectra of the intermediate with 57Fe-enriched and natural-abundant (control sample) [2Fe–2S] cluster at two magnetic fields corresponding to g1 and g3 values. The g-tensor used for the simulations (same as follows) is g = [1.993, 1.941, 1.847], The hyperfine parameters for simulations are A(57Fe(III)) = [−50.0, −47.0, −51.0] MHz, Euler angle = [0, 15, 0]° and A(57Fe(II)) = [35.2, 16.5, 18.5] MHz, Euler angle = [0, 13, 0]°. B, Pulse sequences of the VMT Davies- and Mims-ENDOR. C, 57Fe VMT Davies-ENDOR spectra recorded at g3 = 1.847. D&E, Orientation-selected Q-band ENDOR spectra (D, Davies ENDOR, E, Mims ENDOR) of the intermediate with (guanidino-15N2)-arginine. Simulation parameters for two 15N from Arg260 (red traces and red shades) are A(15Na) = [3.65, 4.10, 7.23] MHz, Euler angle = [150, 35, 0]°, and A(15Nb) = [0.70, 1.28, 1.79] MHz, Euler angle = [0, 42, 0]°. Simulation parameters for the third 15N (green shades) are A = [−0.62, −0.74, −0.90] MHz, Euler angle = [100, 48, 0]°. F, Orientation-selected Q-band VMT Mims-ENDOR spectra of the intermediate with (guanidino-15N2)-arginine. Spectra were recorded with tmix =100 μs, and only the ENDOR transition corresponding to β electron spin manifold is detected, favoring us with more accurate simulations of the two 15N (15Nb and the third 15N) with opposite signs of hyperfine couplings.
All the experimental spectra are in black (except for the red trace shown in Figure C, which is also the experimental spectrum), while the simulated spectra are colored. Particular spectrometer settings for the ENDOR-spectra shown in Figure 3 were as follows: 8 K, 34.07 GHz, microwave inversion pulse π = 56 ns, π/2 = 12 ns, τ = 300 ns, and RF pulse = 50 μs for Figure A; 10 K, 34.06 GHz, microwave inversion pulse π = 80 ns, π/2 = 12 ns, τ = 300 ns, and RF pulse = 20 μs for Figure 3D; 10 K, 34.11 GHz, π/2 = 12 ns, τ = 240 ns, and RF pulse = 20 μs for Figure E. Figure C and Figure F have the same spectrometer settings as Figure A and Figure E, respectively, except for the mixing time tmix.