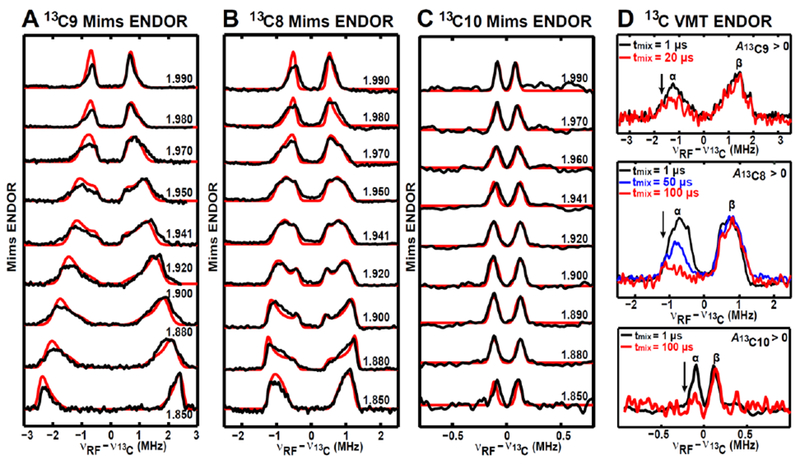
Figure 5. Orientation-selected Q-band Mims-ENDOR spectra of the paramagnetic intermediate with magnetic nuclei (13C9, 13C8 and 13C10) from the substrate DTB.

A, Mims-ENDOR spectra of 13C9-DTB-labled intermediate. B, Mims-ENDOR spectra of 13C8-DTB-labeled intermediate. C, Mims-ENDOR spectra of 13C10-DTB-labeled intermediate. D, 13C VMT-ENDOR spectra of the paramagnetic intermediate recorded at g = 1.941 and T = 10 K. The ENDOR transitions corresponding to β electron spin manifold in the spectra acquired by using various tmix are normalized, with the decreases in the ENDOR transitions corresponding to α spin manifold.
Experimental parameters: 10 K, microwave pulse π/2 = 12 ns, τ = 140 ns for 13C9, 240 ns for 13C8, 300 ns for 13C10, RF pulse = 30 μs. Simulation parameters: g = [1.993, 1.941, 1.847]; A(13C9) = [1.30, 0.85, 4.98] MHz, Euler angle = [90, 11, 100]°; A(13C8) = [1.00, 0.70, 2.60] MHz, Euler angle = [110, 36, 90]°; A(13C10) = [0.18, 0.14, 0.31] MHz, Euler angle = [70, 125, 10]°. All the experimental spectra are in black, while the simulated spectra are in red, except for the VMT ENDOR spectra in Figure D. The BioB enzymes used to generate these three intermediate samples are natural abundant.
