
Figure 7.
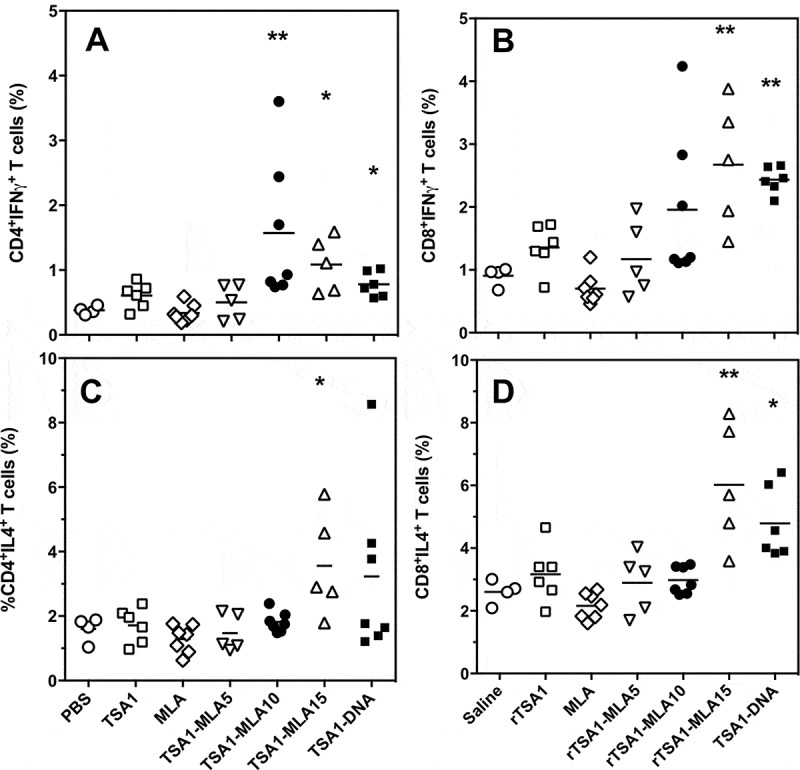
Effect of vaccine formulation on T cell phenotype.
T. cruzi-infected mice were treated with the indicated vaccine formulations, including saline solution, rTSA-1, MPLA, combinations of rTSA-1+ MPLA at doses of 5, 10 and 15 µg, and TSA-1 DNA (N = 4 to 7 mice per group). Splenocytes were harvested at 50 days post-infection, and stimulated in vitro with rTSA-1. Antigen-specific CD4+ (A and C) and CD8+ (B and D) T cells were analyzed for their production of IFNγ (A and B) and IL-4 (C and D) cytokines. Vaccine treatment resulted in significant differences in IFNγ-producing CD4+ (Kruskal-Wallis = 25.24, P < 0.001) and CD8 + T cells (Kruskal-Wallis = 25.96, P < 0.001), as well as in IL-4-producing CD4+ (Kruskal-Wallis = 13.51, P < 0.035) and CD8 + T cells (Kruskal-Wallis = 25.86, P < 0.001). * and ** indicate a significant difference with the saline control group (Dunn’s post-hoc test, P < 0.05 and P < 0.01, respectively).