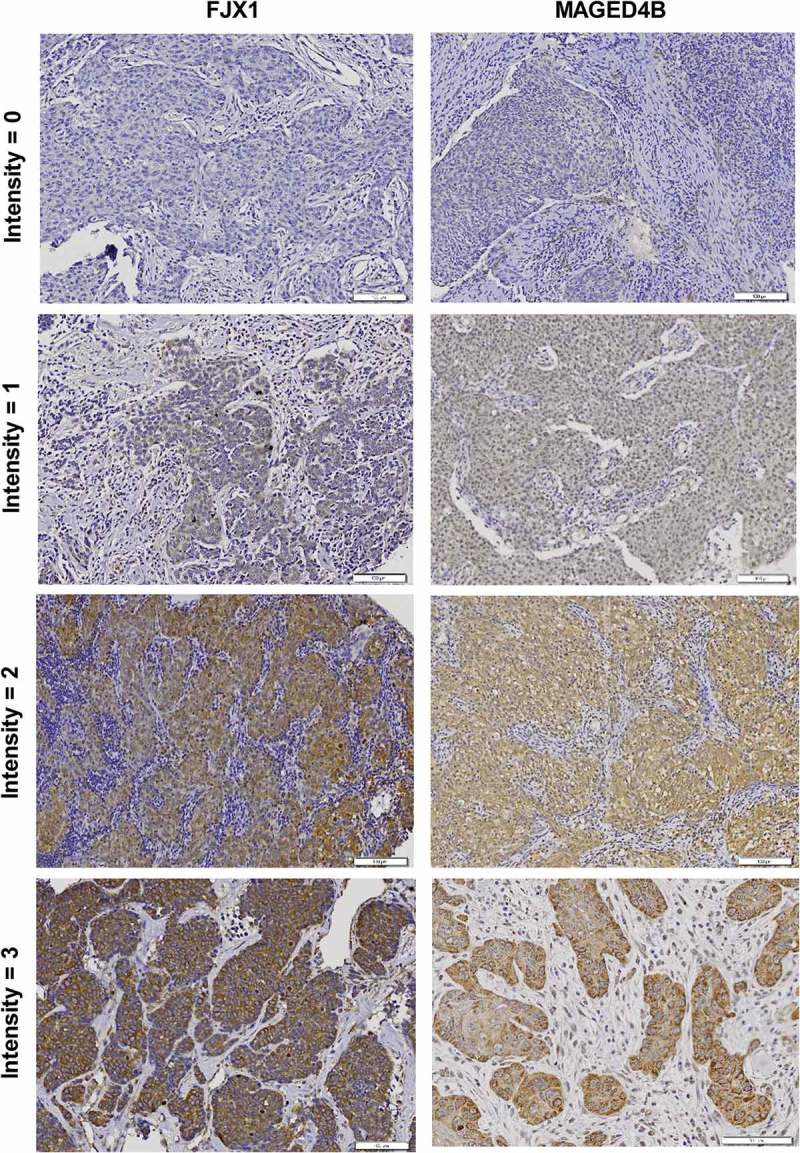
Figure 2.

Expression of MAGED4B and FJX1 in HNSCC samples.
Representative images of intensity scores for IHC staining, ranging from negative (intensity = 0), to weak (intensity = 1) and strong (intensity = 2–3) staining.

Expression of MAGED4B and FJX1 in HNSCC samples.
Representative images of intensity scores for IHC staining, ranging from negative (intensity = 0), to weak (intensity = 1) and strong (intensity = 2–3) staining.