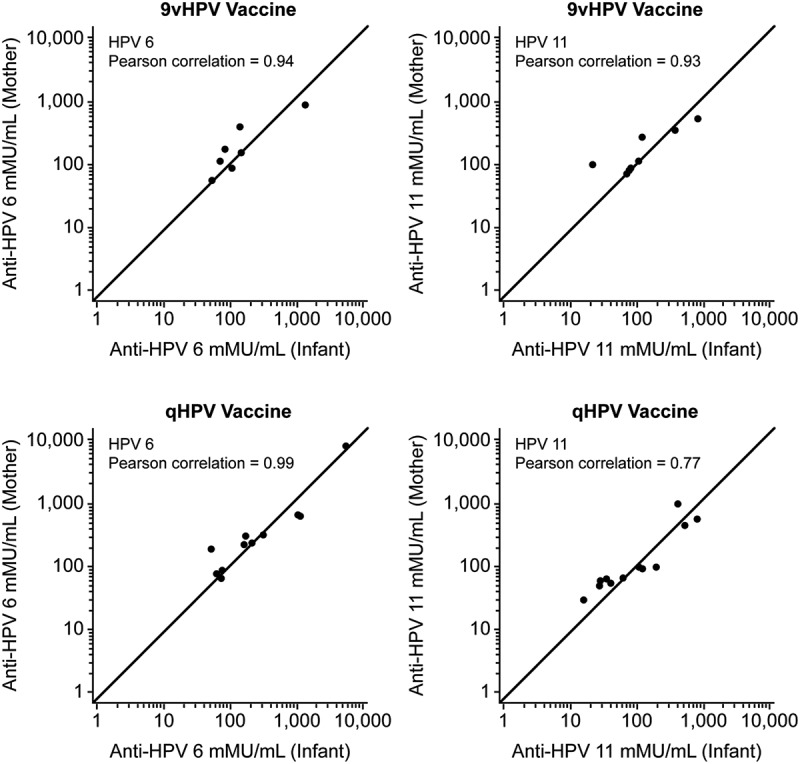
Figure 1.

Scatter plots of the mother- infant HPV cLIA data points (x = cord blood anti-HPV result, y = maternal serum anti-HPV result) by vaccine group. Pearson correlation coefficients of 0.94 and 0.93 were calculated for HPV 6 and 11 in the 9vHPV vaccine group and 0.99 and 0.77 for HPV 6 and 11 in the qHPV vaccine group.
