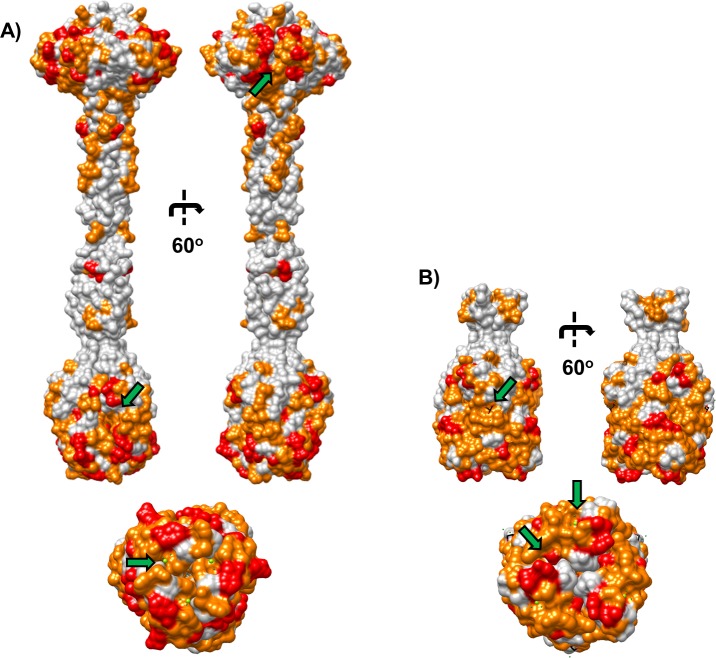
Fig 6. R-subtype polymorphism surface map.
Surface rendering of R1 and R2-NTF structures with solvent accessible R-subtype polymorphism (SARP) associated residues highlighted. SARP residue patches in regions of negative curvature reveal putative receptor binding interaction sites (green arrows). (A) R2-NTF structure with surface residues different between all R-subtype pyocin tail fibers (red) and residues different only between R1 and R2-subtype pyocin tail fibers (orange) are highlighted; (top) Lateral view rotated 60o, (bottom) Distal view along central axis. (B) R1-NTF structure with surface residues different between all R pyocin tail fiber subtypes (red) and residues different only between R1 and R2-subtype pyocin tail fibers (orange) are highlighted; (top) Lateral view rotated 60o, (bottom) Distal view along central axis.

