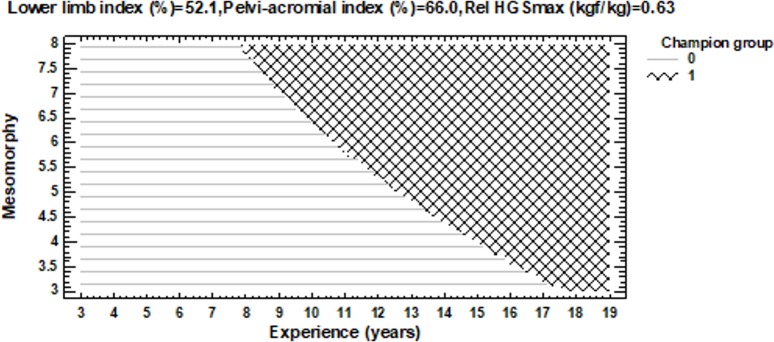
Fig 5. Classification plot.
0—the rest group, 1 –the ten best all-arounders. Each fill type-coded region corresponds to a different group. Experience and mesomorphy are used to define the horizontal and vertical axes, while the lower limb index, pelvi-acromial index, and relative HGSmax are held at fixed values.

