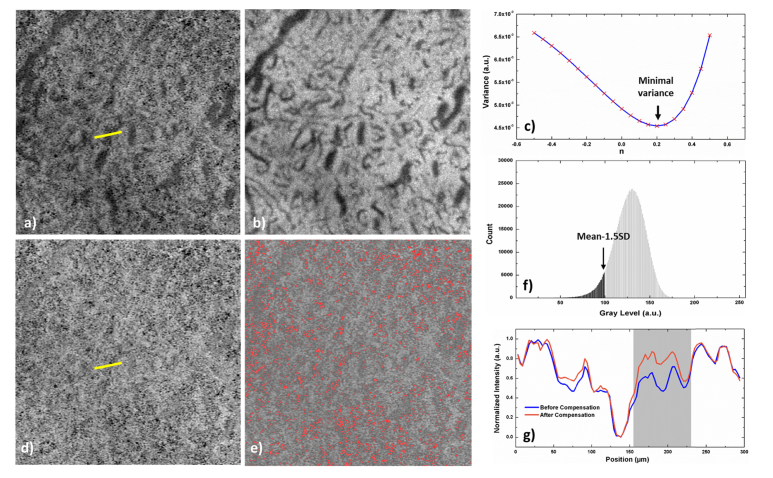
Fig. 4.
Illustration of flow void segmentation method. (a-b) Angiographic and structural enface images of the choriocapillaris. (c) The variance of the adjusted image reaches its minimum when n equal to 0.2 in this particular image. (d) The adjusted choriocapillaris image where the dark region from the deep choroidal vessels is compensated. (e) The choriocapillaris with flow voids labeled in red while the threshold level is set to be from the grayscale histogram of the image (f). The intensity profiles of the yellow lines in uncompensated (a) and compensated (d) choriocapillaris images are plotted in (g). The low intensity region affected by the deep choroidal vessels is compensated (gray region in the plot), while the overall contrast is not changed.

