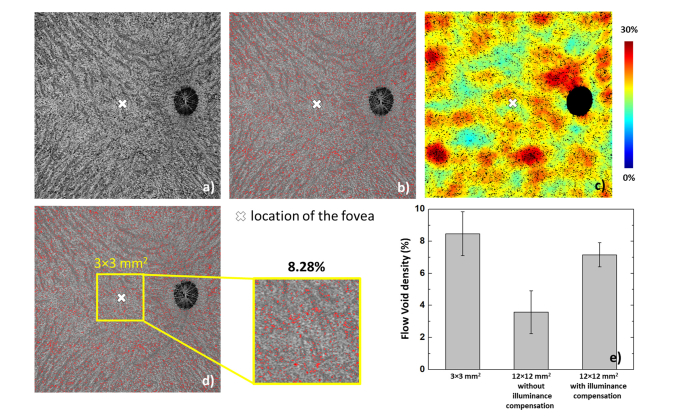
Fig. 9.
(a) The original choriocapillaris image. (b) the choriocapillaris image overlaid with the segmented flow voids (red). (c) The flow void density distribution map generated from (b), while the flow voids were shown in black color for better visualization. (d) A 3 × 3 mm2 area cropped around the fovea from the wide field image, and the flow void density within is 8.28%, where for the same region, the corresponding flow void density from a densely sampled 3 × 3 mm2 protocol is 7.48%. (e) Statistical comparison of the same 3 × 3 mm2 area acquired from acquired by 3 × 3 mm2 protocol, 12 × 12 mm2 without uneven illuminance and 12 × 12 mm2 with uneven illuminance compensation. Data are shown as mean ± SD.

