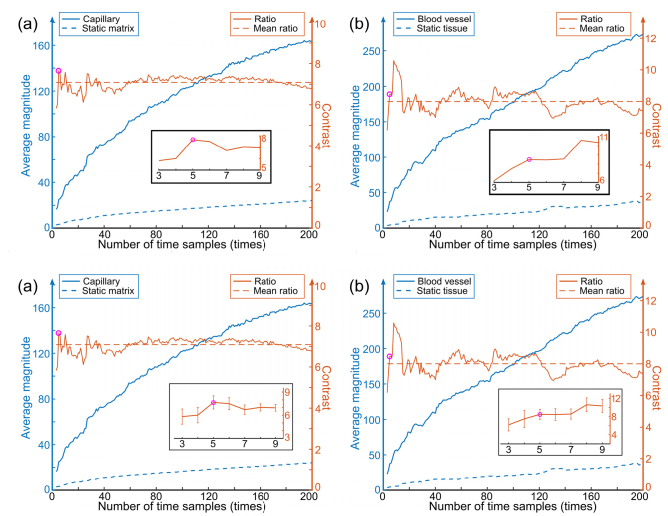
Fig. 2.
Vessel contrast in time series OCTA for varying numbers of time samples (i.e., co-located B-scans) in the phantom (a) and skin tissue (b). The average high-pass frequency magnitude versus number of time samples is shown for the flow (solid blue) and static tissue regions (dashed blue) with reference to the left vertical axis. Their ratio is shown by the solid orange plots with the mean value marked by the dashed orange line relative to the right vertical axis. Insets show the magnified traces of contrast for 3-9 samples. The magenta circles indicate the ratios for 5 samples.

