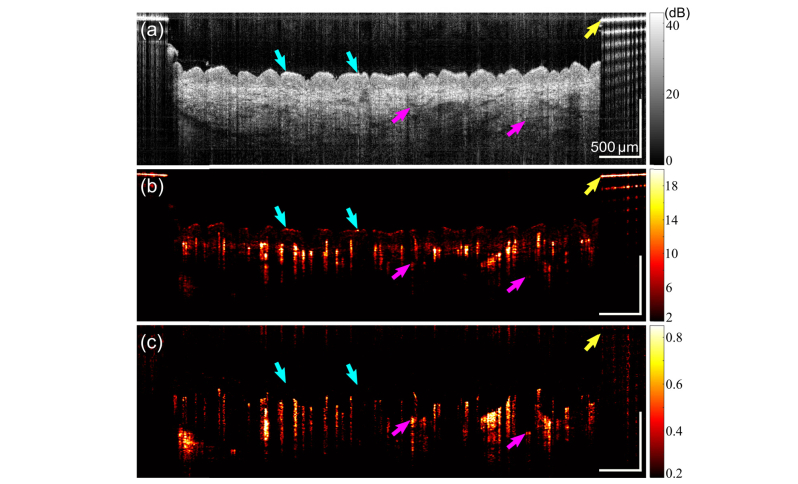
Fig. 3.
Cross-sectional OCT image (a) and vessel image in short-time series OCTA before (b) and after (c) weighting by the inverse of the mean OCT intensity signal. Arrows indicate the corresponding pixels in the three images at the tissue surface (cyan), blood vessels (magenta) and metal marker surface (yellow), respectively. Scale bars: 500 µm.

