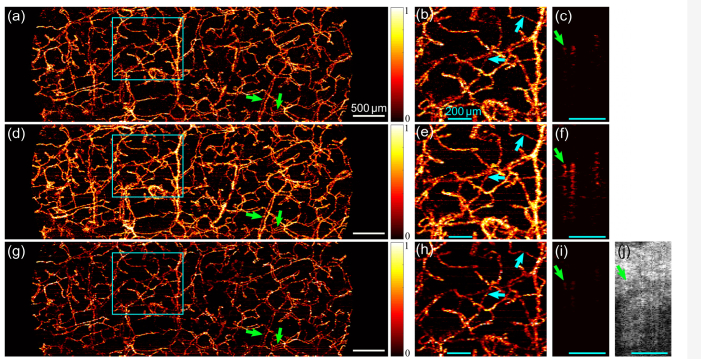
Fig. 6.
OCTA comparison case 2. Projection of blood vessels by speckle decorrelation (a), short-time series (d) and speckle variance (g). The outlined regions in (a), (d) and (g) are magnified in (b), (e) and (h), respectively. Vessels from the forearm skin are projected from the surface to 300 µm in depth. The arrows in the projections mark the same vessel segments. Cross-sectional views of the vessel marked by the left green arrows in (a), (d) and (g) are shown in (c), (f) and (i), respectively. (j) OCT image (0-41 dB) corresponding to (c), (f) and (i). White scale bars: 500 µm. Cyan scale bars: 200 µm.

